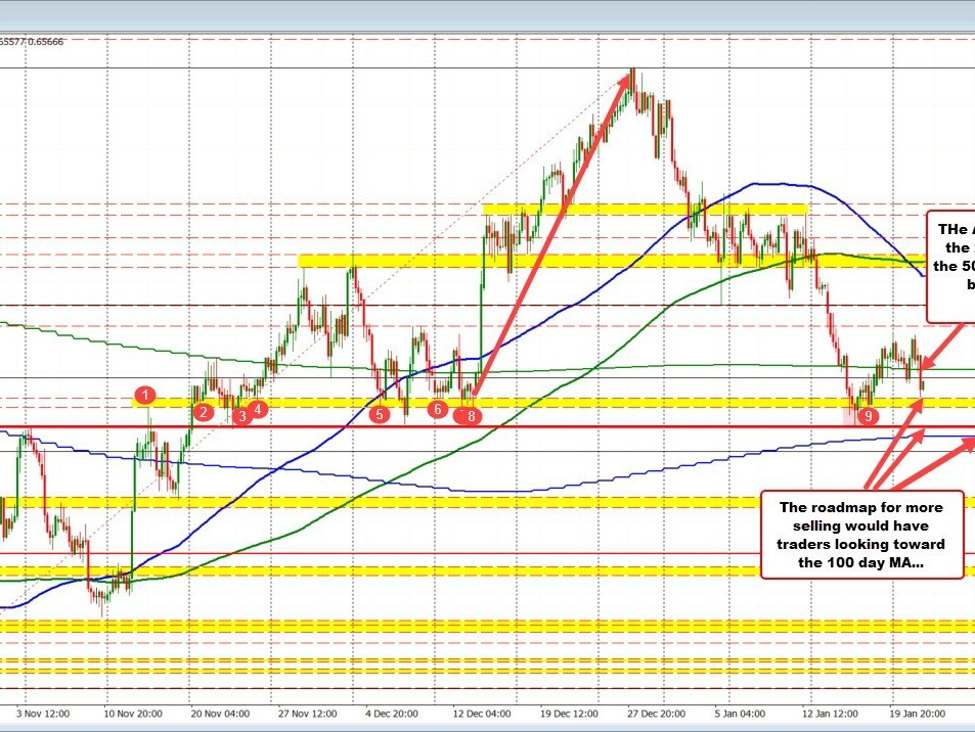
If I were to give a technical tilt for the AUDUSD, the bias is to the downside.
Looking at the 4-hour chart,
- The price is now below the 200-hour moving average 0.65779 (green overlay line on the chart below). Bearish
- The price is also below the 50% midpoint of the move-up from the October load to the December high. That level comes in at 0.65699. Bearish.
Admittedly, the price has been trading above and below those levels since last week’s trading. So, traders may be still trying to figure out up or down. Nevertheless, with the price now below both those technical levels, the tilt is in favor of the sellers.
However, there is work to do.
The low price today has stalled against the high of a swing area between 0.65417 and 0.6550. That area needs to be breached to increase the bearish bias.
Below that is another swing level/recent floor at 0.65229. Move below that level, and the 100-day moving average of 0.65135 becomes yet another hurdle at 0.65135. The price has not traded below its 100-day moving average since November 17.
So for now although the tilt is to the downside, they below the 200-day moving average is required and extending below the aforementioned targets including the 100-day moving average 0.65135, is the to increase the bearish bias
AUDUSD back below 200 day MA and 50% retracement
