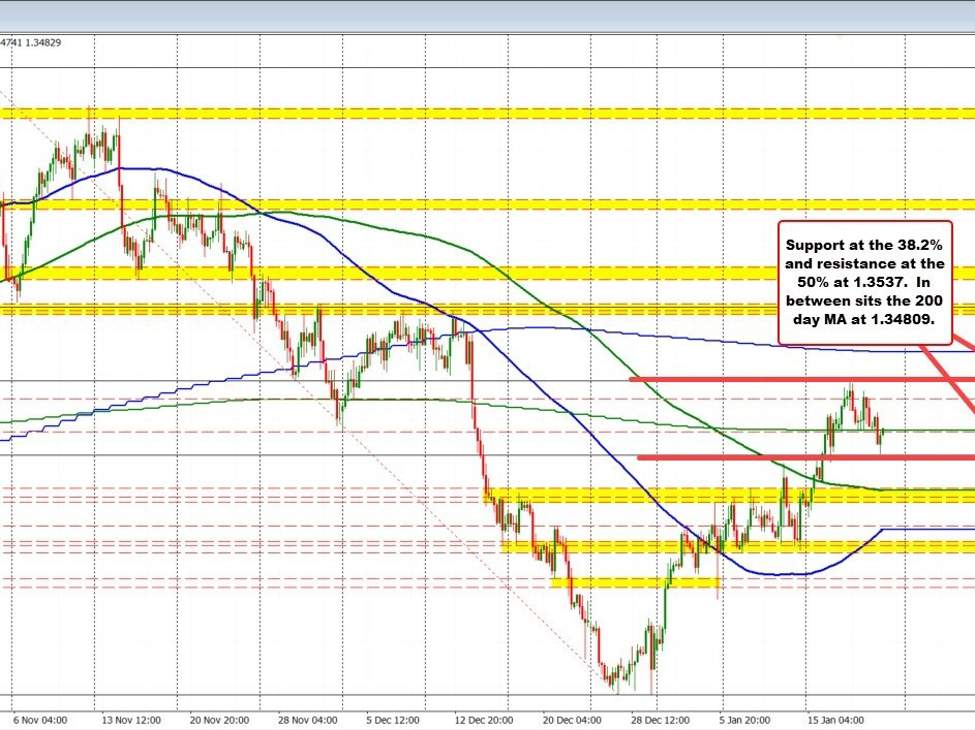
The USDCAD this week moved higher and in the process extended above its 38.2% retracement of the move down from the October high. It also moved above the 200-day MA currently at 1.34809 but stalled the rally at the 50% midpoint of the same move down from the October high.
Traders will often lean (at least temporarily) identity for the reset midpoint, especially after a trend-like move. The subsequent correction to the prospect to the 200-day moving average at 1.34809, and then below that moving average today back down to the broken 38.2% retracement at 1.34523.
So buyers and sellers are battling it out between retracement levels. The 38.2% retracement at 1.34523 is a support. The resistance is the 50% midpoint at 1.3537. In between sits the 200 day moving average at 1.34809.
USDCAD trades between retracement levels
