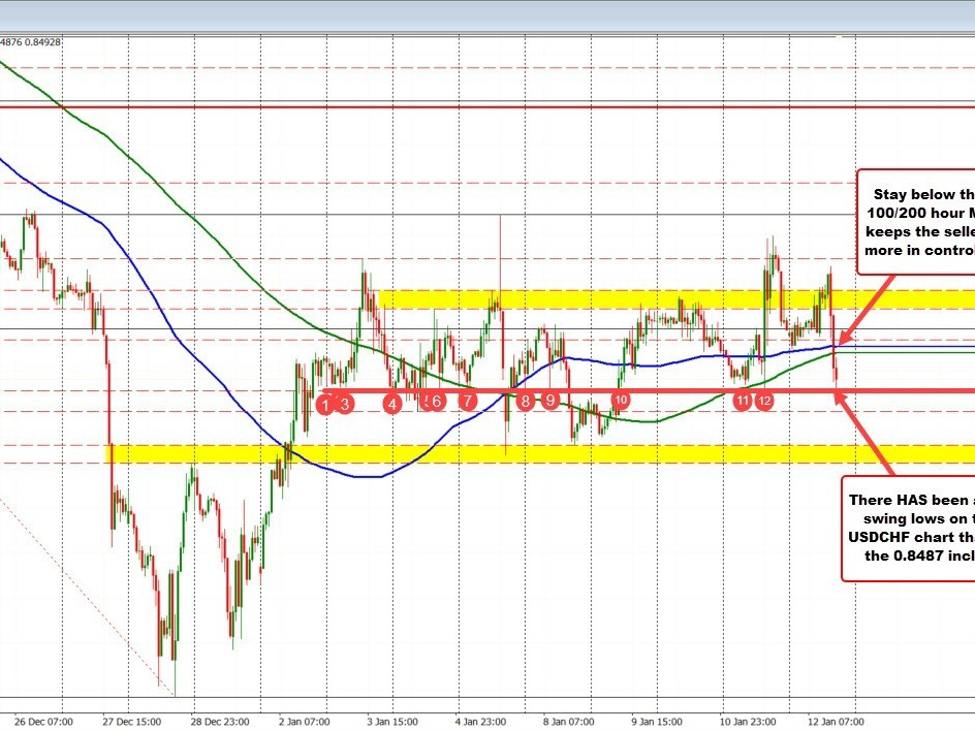
The USDCHF has moved lower after the weaker-than-expected PPI data. That news sent yields in the US tumbling to the downside, and has now pushed the price of the USDCHF below its 100 and 200 hour moving averages near 0.8508 (dollar selling).
The low-price extended to the low-price from yesterday at 0.8487. Looking at the chart below, that level is also home to many different swing lows going back to early January (for whatever reason – it is somewhat random but now a key barometer).
What now?
Stay below the 100 and 200 hour MAs in the short term keeps the sellers more in control. The downside a move below the swing level at 0.8487 opens the door for a potential move toward a swing area between 0.8450 and 0.84595.
USDCHF falls below 100/200 hour MA. Tests key swing level
Overall, however,for most of the trading year, the price action in this pair has been up and down. At some point, the price will break out of what has been a range which is most of the price action between 0.8450 and 0.8554. Traders will use the clues in between to help determine a bias and then look for a break in the direction of the bias at some point.
