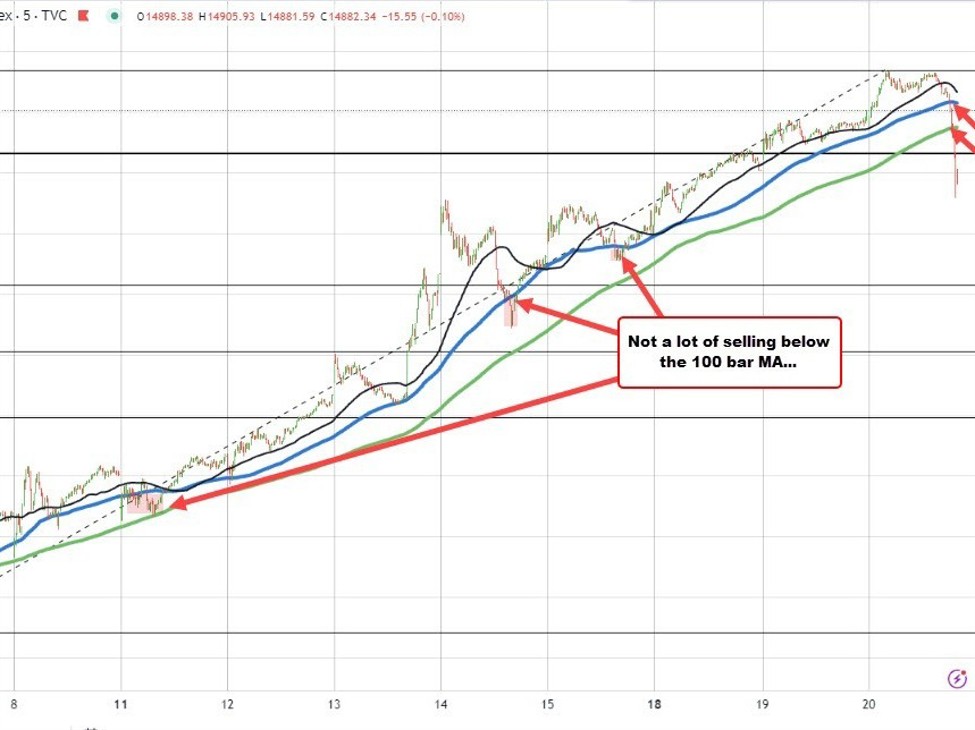
The major US stock indices have hit the skids with the NASDAQ down 100 points now or -0.68%. The S&P index is also down by around the same amount.
Nasdaq falls below 100 and 200 bar MAs
Looking at the short-term five-minute chart of the Nasdaq index, the fall below the 100 bar MA started the decline and then gathered more momentum on the break of the 200 bar MA (green line). The last time the price traded below its 200-hour moving average was back on December 23. The 38.2% of the move up from the December 7 low comes in at 14715. and is a downside target now.
The S&P got within 18 points of the all-time high close.
The S&P and NASDAQ are now down about 1% on the day. The Dow Industrial Average is down -0.70%
US yields are still lower on the day with the 2-year down -6.6 basis points, while the 10-year is down -4.7 basis points.
