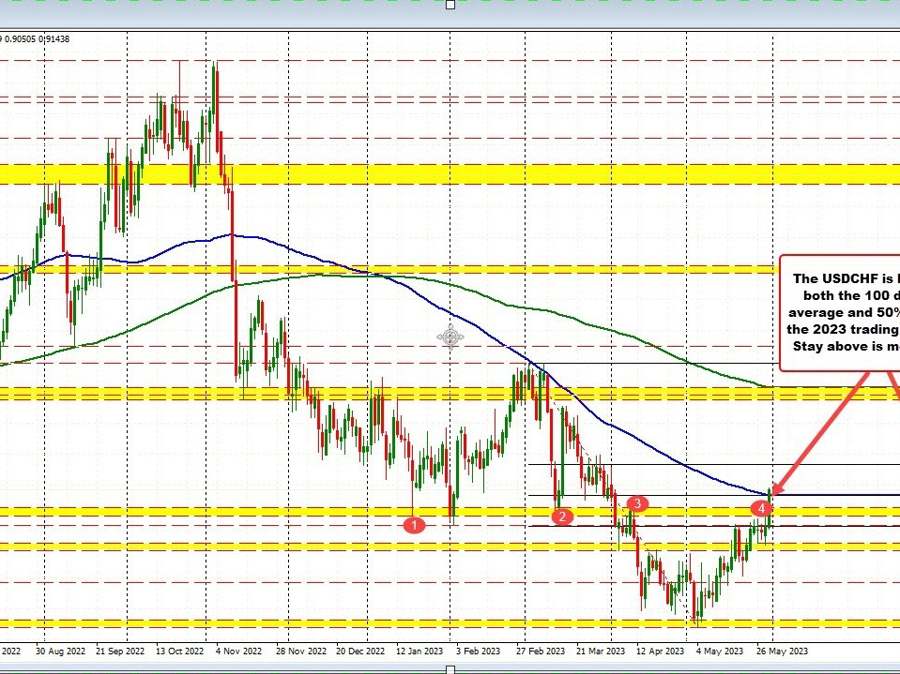
The USDCHF is up sharply today extending above a swing area on the daily chart between 0.9081 and 0.91015. The break above that area then targeted a dual technical level on the daily chart defined by the 50% midpoint of the 2023 trading range, and the 100-day moving average. Both of those levels come in at 0.91297.
That key level has also been broken increasing the bullish bias on the daily chart. It has also set the level as a close risk level for buyers looking for more upside momentum (short-term stop on a break below 0.9144 – give it a few pips below that key level)..
Taking a look at the 4-hour chart there is a more conservative risk level in play that giveS buyers a better stop level. I outline that level in the video below.
