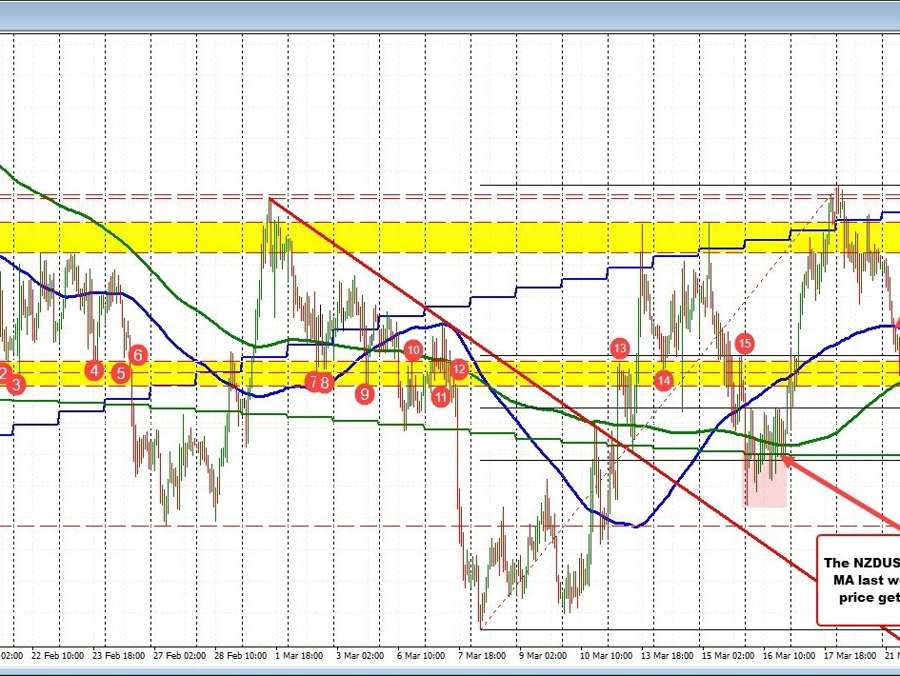
The NZD is currently the weakest among major currencies, with the NZDUSD pair trending downwards, down by 1.15% for the day. Consequently, various technical levels have been successively breached.
Observing the hourly chart above, the price has fallen below the
- 100-hour moving average (blue line at 0.62144),
- 38.2% retracement of the March trading range at 0.6205,
- 200-hour moving average at 0.61968 (green line),
- Swing area between 0.61915 and 0.6203, and the
- 50% midpoint of the March trading range at 0.61818.
The pair is currently trading at 0.61739.
The next downside target, which has not yet been broken, is the 200-day moving average at 0.6160. Last week, the price fluctuated above and below the 200-day moving average on Thursday but failed to maintain momentum on the downside. Sellers had their opportunity but missed it, leading the price to rise on Friday and into early Monday trading.
So, what’s next? Sellers have regained control as the price has fallen below the 200-hour moving average. Those who believe the USD will continue to strengthen should not want to see the price rise above this level and subsequently above the 100-hour moving average. However, staying below the 200-day moving average is equally important for sellers. If the price continues to decline, traders will eye the low from last Thursday at 0.61385, followed by the swing lows from February 27 and 28 near 0.61294.