The GBPUSD buyers have successfully pushed the price above its 100-hour moving average at 1.21129, reaching a new intraday high of 1.2127. Examining the hourly chart above, it’s clear that breaking above the 100-hour moving average took some effort. The market initially attempted this during the European morning session but failed. The price started it’s move back to the downside.
The sellers push to the downside, saw the price extend below the 100-day moving average (currently at 1.20369), but that fall stopped short of the rising 200-hour moving average (green line) at 1.20159.
Sellers turned back to buyers on the failed break below the 100-day moving average, leading to the latest upward move and above the 100 hour MA again.
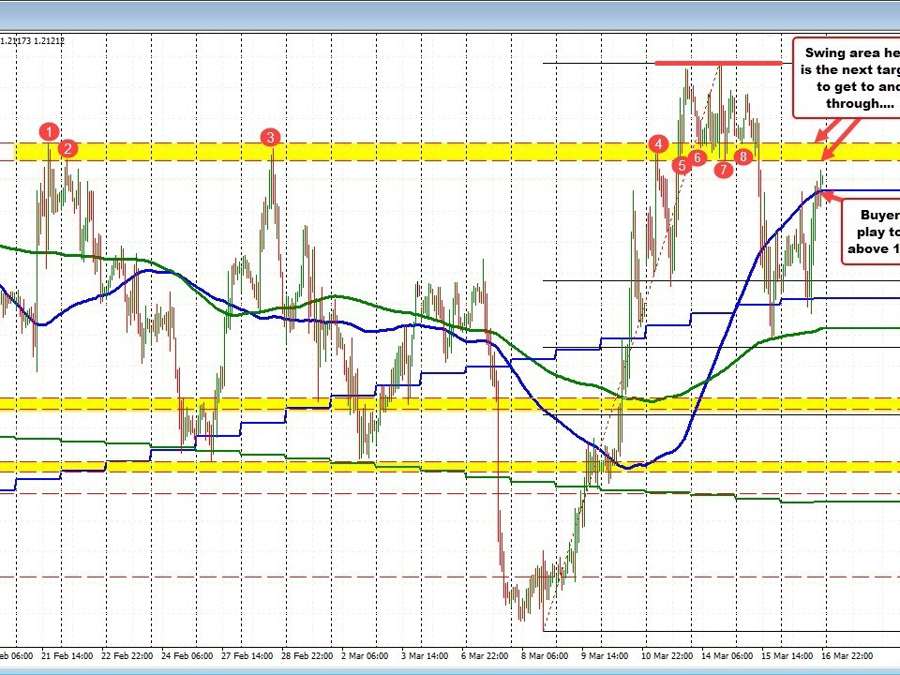
If the price can now maintain its position above the 100-hour moving average, the next upside target area would be the swing region between 1.21342 and 1.21467. This area has been defined by swing highs dating back to February 21. On Monday, the price climbed above this zone, only to fall back below during yesterday’s trading. A renewed move above 1.21467 would target the week’s earlier highs at 1.2202.