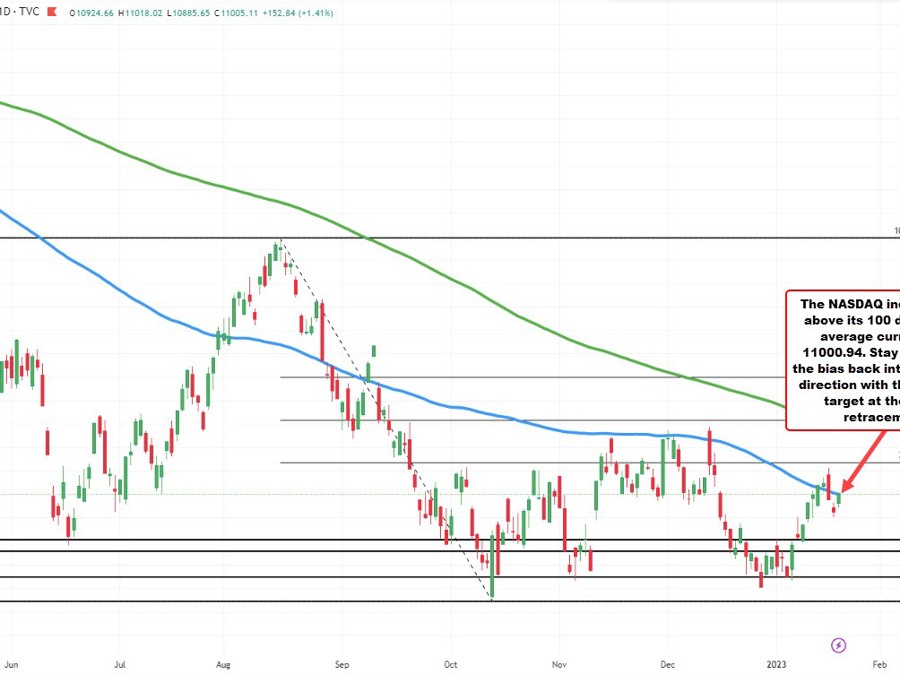
The NASDAQ index is leading the way to the upside today with a 153.47 point rise or 1.41% at 11005. The high price has reached 11018.02.
Looking at the daily chart, the falling 100 day moving average comes in at 11000.95. With the price back above that moving average, it helps to tilt the buys more to the upside from a technical perspective.
Recall from earlier this week the price closed above that 100 day moving average level on both Monday and Tuesday. On Wednesday a new high was made for the week at 11223.41.
However that high fell short of the 38.2% retracement of the move down from the August 16 high at 11270.07, and the price started to rotate back to the downside.
The subsequent fall took the price back below the 100 day moving average, disappointing the buyers.
However if the price can now stay above the 100 day moving average – and close above that level – all the hurt from the failure will be forgotten, and the bias will tilt back into the buyers favor. Key level today. Be aware.