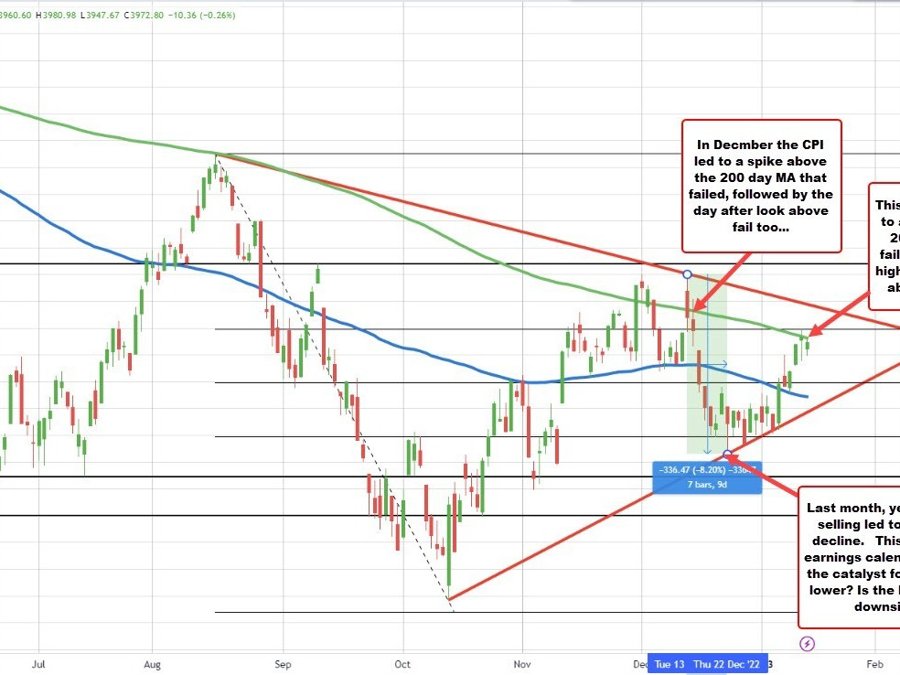
The S&P index on the daily chart moved to and through the 200 day MA on Thursday. It moved above the same MA today too. The MA comes in at 3967.17. The high today reached 3980.98. The high yesterday reached 3997.76.
The price closed just below the MA yesterday. It is currently trading below that MA today at 3972.80.
Visions of December are dancing in my head.
The day of the CPI last month, the price moved above the 200 day MA but closed below that MA level. Failed break. The next day the price moved back above the 200 day MA, but failed again and closed lower. From the December CPI day high to the low on December 22, the index moved down -8.2%.
Oh no. Will the markets do the same this month? Are we in for another big decline?
What is different this month is last month had a lot of year end tax selling that came into play. You can’t really quantify the impact but let’s face it, 2022 was an “annus horribilis” for stocks (at least in recent memory). Tax selling is part of the game when there are losses on the book. You can always buy something else later. It is real. It happened.
What is also different this month is the earning calendar is just getting going. The good news is the expectations have been marked down. So the bar is low and that may give some potential for hope. However, the bad news is the economy is also coming off a strong 4th quarter. Will companies use the opportunity to manage expectations lower en masse, lower forward forecasts, and hedge the downside potential from a slower start to the new year?
So THAT 200 day MA looms as an important barometer for the bulls and the bears. Move above and stay above, then all is well with the world.
Conversely, move/stay below and you have to respect what the “market” price action is saying.
With so much uncertainty, using key technical levels helps to take the “hard’ out of the trading decision. Let the market price action decide the thumbs up or the thumbs down.
/Inflation
