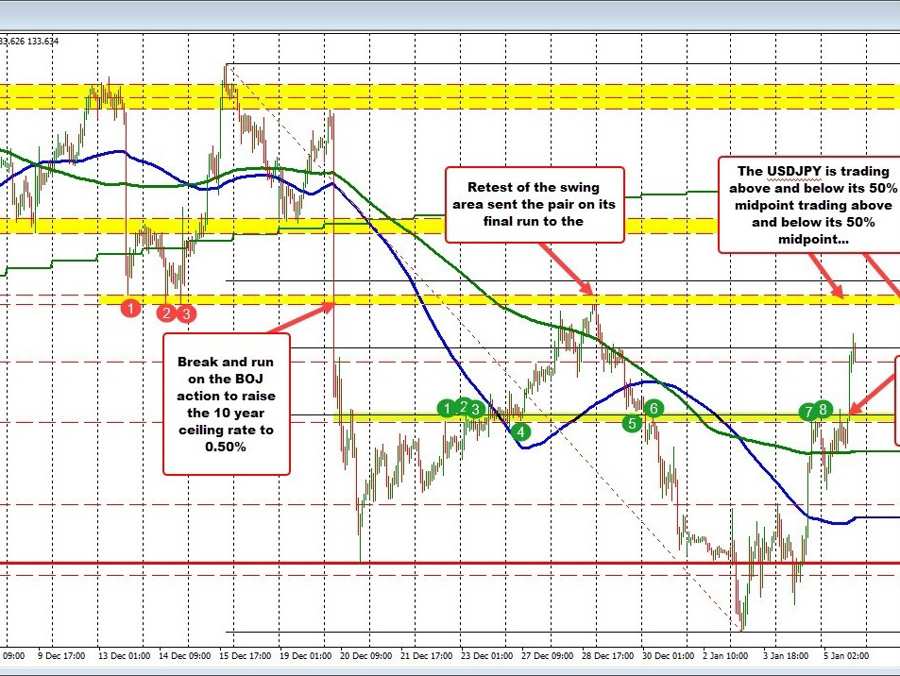
The momentum to the upside in the USDJPY has continued. Technically, the price raced above the 38.2% after the better ADP/initial claims data at 132.81. The price also moved above the 50% of the 2022 trading range for the pair on the daily chart below at 132.70. That midpoint was tested yesterday and stalled the rally.
In the early European session today, the midpoint off the daily was broken, but could not be sustained. The price rotated back to retest the 200 hour MA (see green line on the hourly chart above), before getting the kick higher off the data today. The midpoint level at 132.70 is now in the rearview mirror and will be a key barometer for buyers and sellers go forward. In December, the price did trade below and back above, and back below as the traders headed into year end. That price action could have been influenced by year end flows.
However, with the new year, traders will now want to see that level hold support. Be aware.
Looking at the hourly chart at the top of the post, the next key target area on further upside momentum comes between 134.49 and 134.65. That level represents swing lows going back to mid-December and the swing high from December 28 which stalled the rally before the rotation to the low reached on January 3 at 129.498 (see red numbered circles on hourly chart).On December 20, the price smashed below that area on the back of the BOJ raising the target ceiling for the 10 year to 0.50% from 0.25%. There should be willing sellers near that area on the first test.
For now there is some stall near the 50% midpoint level on the hourly chart. Buyers and sellers are in a battle around the level That may give buyers some cause for pause, but what we do know is the 132.70 area should now be support.
