Gold has seen its price move lower on the back of the stronger than expected US jobs report and higher dollar. But as they dollars gains have been eroded, the price of gold has likewise seen a rebound back to the upside.
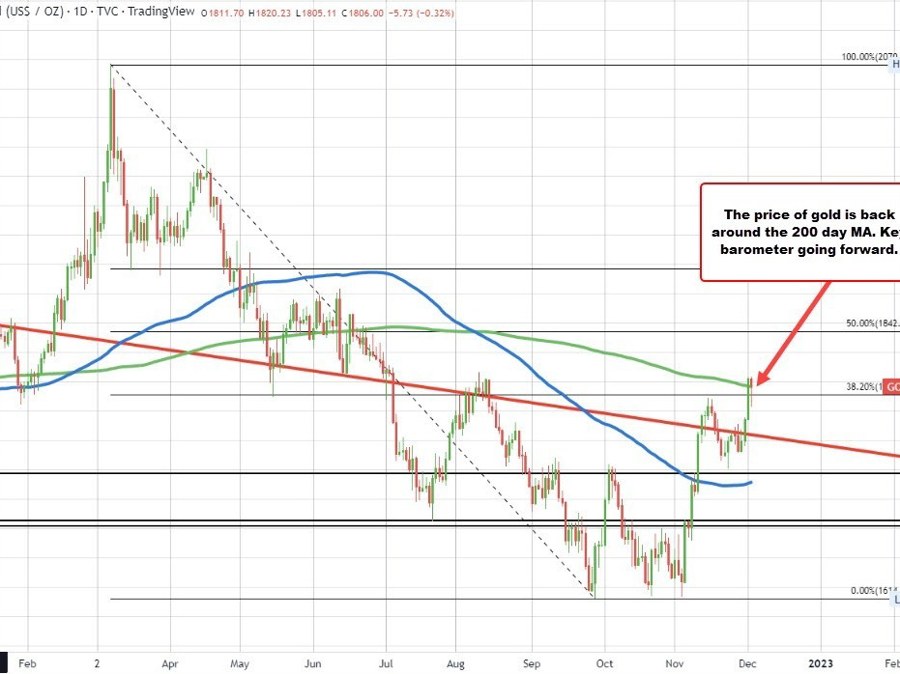
The price has moved back above its 200 day moving average (green line in the chart above) at $1795.75. The price is currently trading above and below that MA after reaching to a corrective high at $1798.55. The 200 day MA is a barometer for the buyers and sellers. Move above is more bullish. Move below is more bearish. Before yesterday, the last time the price traded above its 200 day moving average is back in mid – June.
Taking a broader look at the weekly chart, the price of gold is approaching its key 100 week moving average. That level comes in at $1800.32. The high price this week reached $1804.45. Getting above that weekly moving average would be a another positive from a technical perspective. Stay below is more bearish.
For the trading week gold is up around 2.36%.
So on the daily chart in weekly chart, the price of gold is testing some key moving average levels between $1795.75 and $1800.32