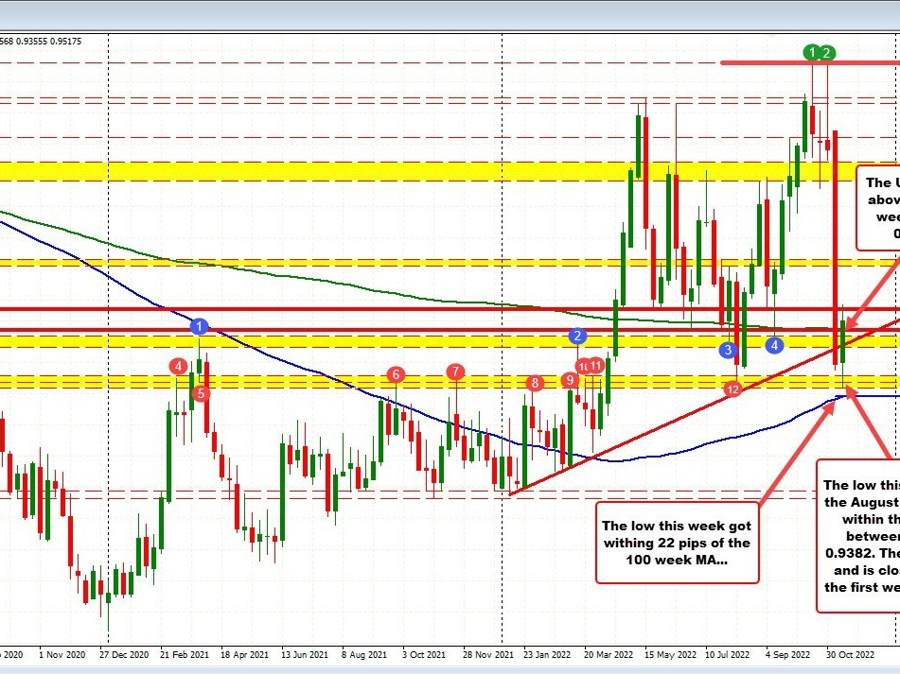
The USDCHF lost value over the last 4 weeks and that momentum continued in the early part of the week. The price moved below the August low at 0.9370, completing an up and down lap that saw the price move up to an October high at 1.0148 and a retest of that high just two weeks ago before tumbling lower.
The move to the downside from those highs, took the price down -7.8% or close to 800 pips from the high to the low. At the low, the USDCHF got within 22 pips of the 100 week MA. The pair also stalled in a swing area between 0.9357 and 0.9382 (see red numbered circles on the weekly chart above).
The bounce has seen the pair move up 1.8% currently. For the week (from last Friday), the price is up 1.18%.
What I see on the daily chart below, is the USDCHF has a number of sharp ups and downs in 2022. That is the pattern and the market can get used to that pattern.
The move lower since the November peak, saw the price slice below the 100 and 200 day MA like a hot knife through butter (blue and green lines). Last Friday, the pair moved below an upward sloping trend line and tried to stay below, but yesterday, the price moved back above that broken trend line. A shift? Buyers pushed higher. Can they now keep that momentum going to the upside?
That trend line cuts across at 0.9482. There is a swing area on the daily near that level between 0.9453 to 0.9479. Stay above that area is now support and would keep the snap back higher idea in play.
Drilling to the hourly chart below, the price is trading between the 100 hour MA below and the 200 hour MA above. The high this week, stalled ahead of the 38.2% of the last trend move lower (at 0.9563). If the buyers are to take move control – and potentially set the traders up for another run higher – getting above the 38.2% and then the falling 200 hour MA (green line) at 0.9563 and 0. 95829 respectively is needed. Above those levels, and the 50% and swing area near 0.9627 would be the next key upside hurdle.
Buyers are trying. The price is above the 100 hour MA. The low this week stalled in a swing area on the weekly chart and got within 22 pips of the KEY 100 week MA. Will the ‘try’ lead to results?. Will the buyers gather MORE upside momentum?
That will be determined if the price can reach and break some of the upside targets outlined in this post.
It will also be determined if broken levels on the move higher this week, like the 100 hour MA holds any dip. If that can happen, the buyers are still in play. If that does not happen, the pair moves lower.
