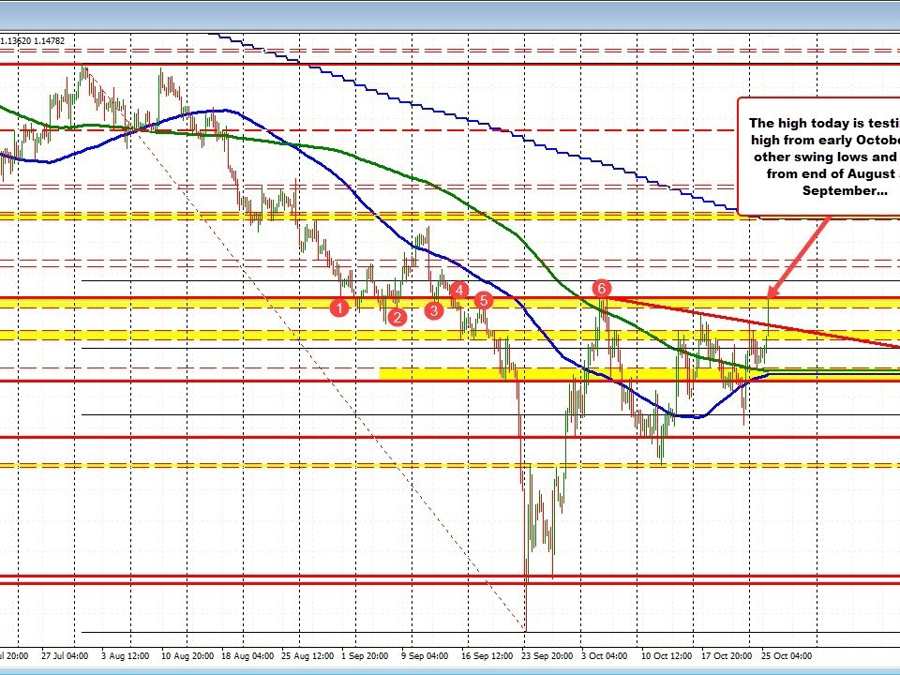
The GBPUSD has moved up to test the October high near 1.1495. The high price just reached 1.1498 (see 4 hour chart above).
The price has backed off and currently trades at 1.1478. Also near the October high are swing lows and highs going back to the end of August and into September.
The swing area between 1.1459 and 1.1495 is home to those swing levels. Move back below 1.14595 – and stay below – could see some rotation back to the downside.
Coming into the New York session, the trading range for the GBPUSD was a modest 70 pips. That was well below the 22 day average of 243 pips (about one month of trading). The current range is up to 229 pips as non-trending day found strong buyers.
Looking at the 5 minute chart below, the price rise started after basing against its 100/200 bar moving averages. The 38.2% of the move up from that low comes in at 1.1424. The 50% of the run higher comes in at 1.1401. Moves below those levels would increase the bearish bias.
