The ISM manufacturing index came in little better than expectations of 56.7 vs. 56.0 estimate. The prices paid did decline but employment rise ahead of the nonfarm payroll report on Friday.
US stocks are continued its moved to the downside. The Dow industrial average down -1.17% the S&P index is down -1.54% point, and the NASDAQ index is down -1.94%.
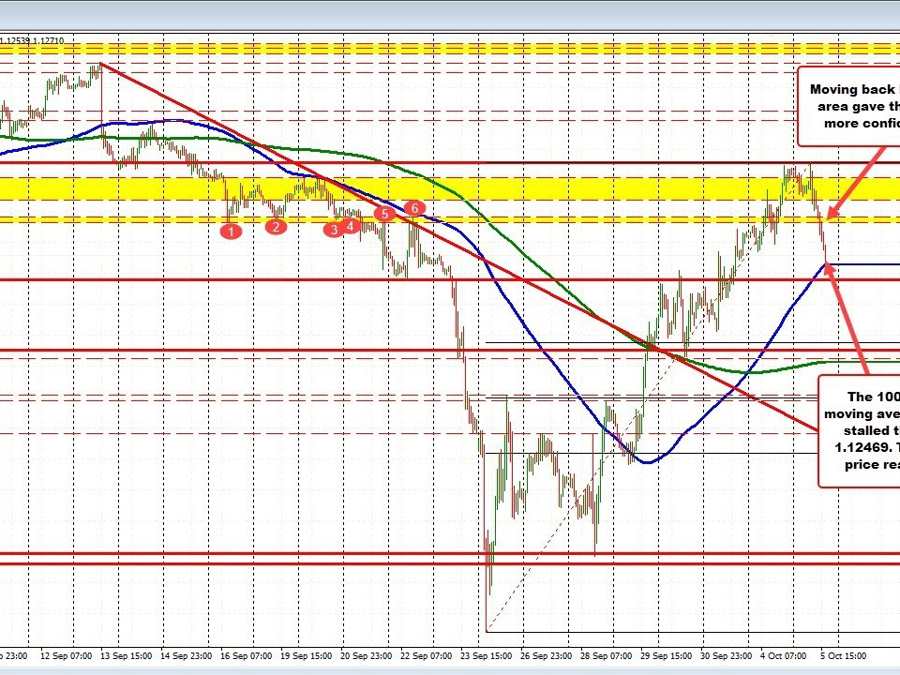
For the GBPUSD, the price has move back down to retest its 100 hour moving average 1.12469. Last Wednesday the price moved above its 100 hour moving average for the 1st time since September 13. On Thursday, the price retested that moving average but found dip buyers near the level. That helped to turn the pair around from a technical perspective.
The run to the upside took the price just short of the 1.1500 level (the high price reached 1.1495 both yesterday and again today) before buyers turned to sellers.
The low price today just reached 1.12539. That’s around 7 pips away from the 100 hour moving average. The current price trades at 1.1270.
Traders will behind that 100 hour moving average as support. A move below might look toward the 1.12115 level which was a swing low on September 22 and a swing high on September 23 after breaking below. The 38.2% retracement of the move up from the all-time low at 1.0353 Is way down at 1.10589. With these big moves in the GBPUSD seen over the last few weeks, there is a lot of space between technical levels. The 200 hour moving average is even below the 38.2% retracement level. It currently comes in at 1.10106.
First things first for the sellers is to crack the 100 hour moving average.