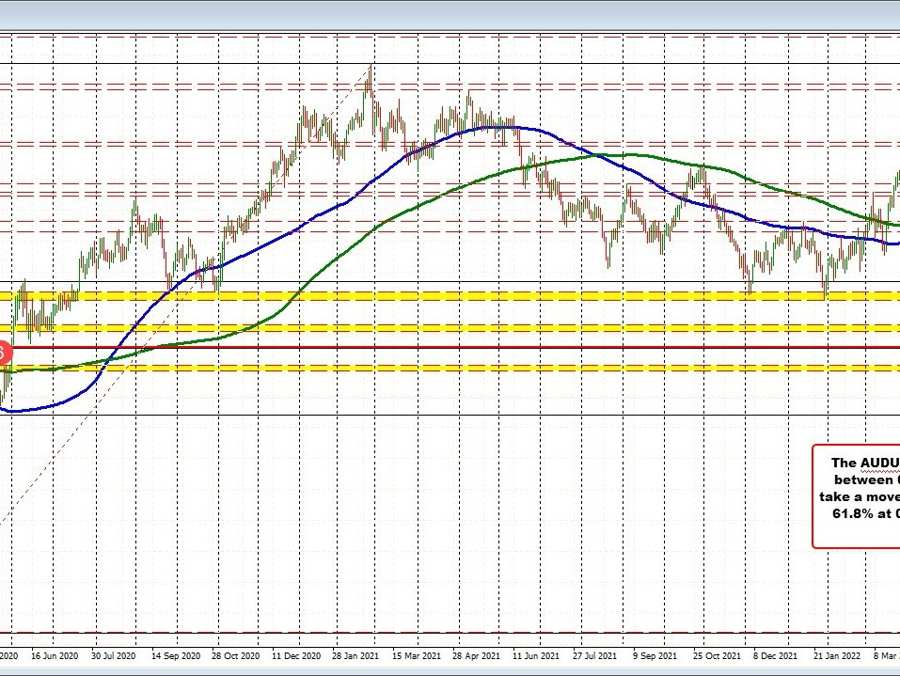
As stocks continue to run lower, with the Nasdaq down -220 points or near 2% and the S&P donw -76 points or -2.04%, the AUDUSD is continueing to take it on the chin. The pair is down -1.52% on the day which is only eclipsed by the GBPs 3% tumble vs the USD.
Looking at the weekly chart, the pair moved below a swing area this week between 0.6656 to 0.66809. The high price yesterday and today stalled into that range, but found willing sellers (see red numbered circles on the daily chart).
Drilling to the 5 minute chart, the pair has 3 legs lower today. Each has seen a modest correction. The first two stalled the rally against the 100 bar MA and the 38.2-50% of the “leg lower”. The current leg has stayed well below the 38.2%. Sellers are in firm control/the trend is intact below that correction zone currently between 0.6556 and 0.65629 (a new low, adjusts those levels).
Stocks trade to new session lows.
