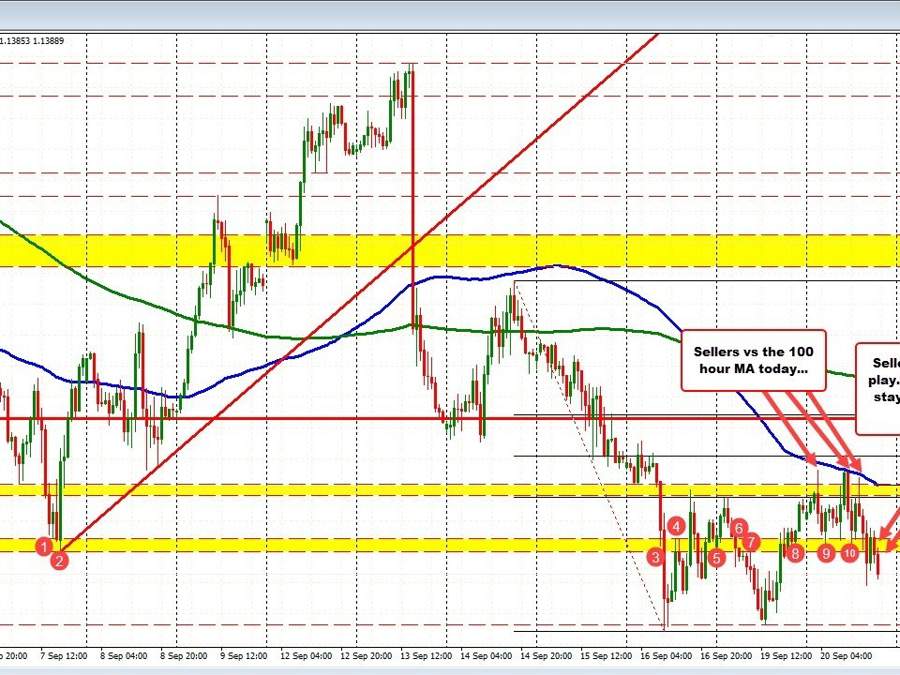
The GBPUSD has been waffling above and below the 2020 low at 1.1408 and the old 2022 low from September 7 at 1.1404. The price is trying to move further away from those lows in the current hourly bar with the price at 1.1388 currently. The sellers are making a play with the low for the day at 1.1381 targeted.
A move below that low (just because its the low) would have traders looking toward the low from yesterday and last week at 1.1354 and 1.13458 respectively. Those lows are the lowest levels since 1985.
With the Fed ahead, of course much is at stake and volatility will be high.
What we do know is that 100 hour MA at 1.14496 held resistance today on three looks. Each found sellers lean and the price move lower after each test.
Going forward moving above that level will increase the bullish bias.
Above that, and the 50% of the move down from the last high on September 14 high comes in at 1.1469 (see chart above).
If I upped the retracement level to the high on September 13, the 38.2% of that move comes in at 1.14978 (call it 1.1500). That will be another upside target to get to and through on more upside momentum. See the adjusted hourly chart below).
Above that, and the falling 200 hour MA comes in at 1.15211.
Ultimately, getting above each is needed to turn the bias from more bearish to more bullish in the short/medium term
IN summary upside targets to shift the bias:
- Falling 100 hour moving average 1.14496
- 50% of the move down from September 14 high at 1.1469
- 38.2% retracement of the move down from September 13 at 1.14978
- 200 hour moving average at 1.15211.
