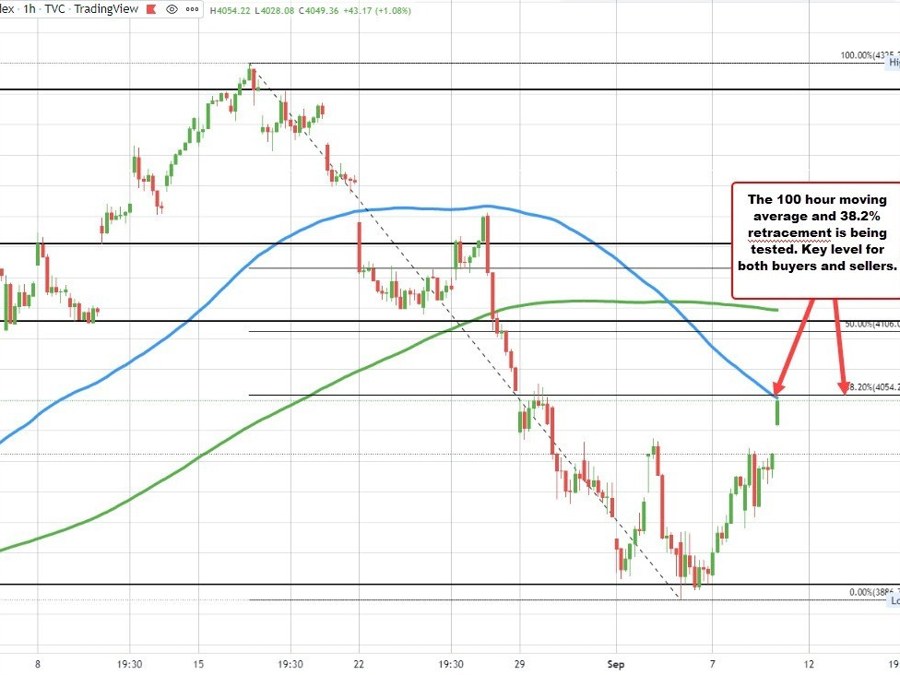
The major US stock indices are up solidly with the NASDAQ leading the way with a 1.51% gain. The S&P index is up 1.08%.
Looking at the hourly chart of the S&P index above, it is testing its 100 hour moving average at 4051.68 (blue line in the chart above) and the 38.2% retracement of the move down from the July high at 4054.27.
The high price just reached 4054.22. The current prices trading at 4050.66.
A move above those levels would increase the bullish bias from a technical perspective. Stay below and the correction is a plain-vanilla variety into technical resistance.
Key barometer for both buyers and sellers being tested.
This article was originally published by Forexlive.com. Read the original article here.
