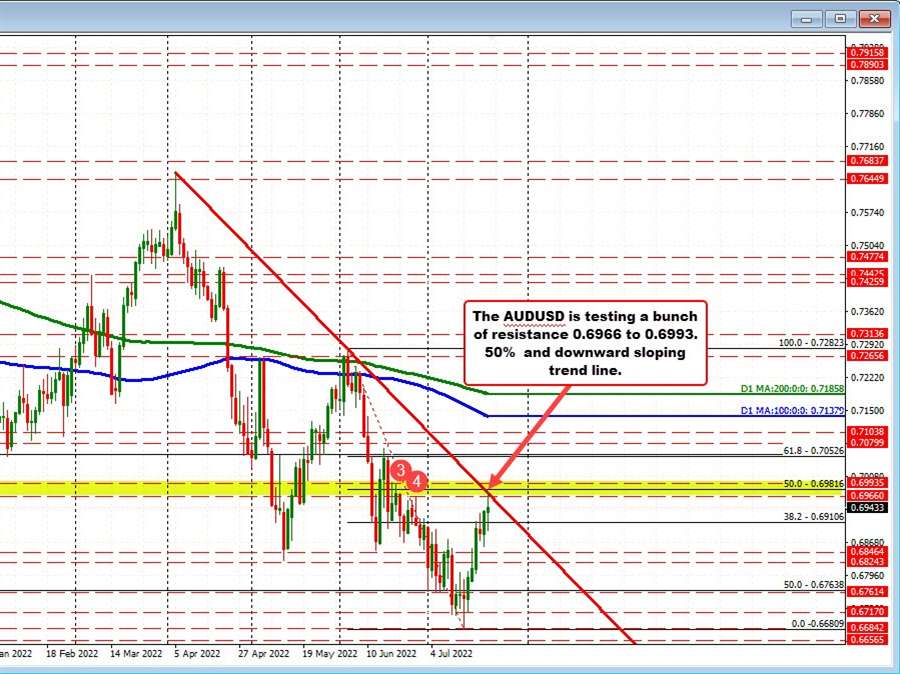
The AUDUSD tested a cluster of resistance on the daily chart between 0.6966 to 0.69935 area today. The area represents a swing area (see yellow area and red numbered circles). Also in the area is a downward sloping trend line at 0.6977 ant the 50% retracement of the recent run down from the June high at 0.69816.
THe high price today reached 0.69768 and has rotated lower.
Going forward and into the new trading week, that area will be a key upside target area to get to and through if the buyers are to take back more control.
Drilling to the hourly chart below, the rising 100 hour MA was broken last Friday to the upside (see blue line), and has not been broken this week. Yesterday, the dip did stall just above the 100 hour MA. The dip today found earlier buyers.
The MA currently comes in at 0.68900 and moving higher. A move below that MA going forward is the next major target to get to and through. Get below is more bearish.
