The SNB hiked rates by 50BPs earlier today. That was a surprise move that has led to a surge in the CHF as a result.
Looking at the % changes of the CHF vs. the major currencies, the gains have ranged from around 1.5% vs the GBP to 3.22% vs the CAD. The EURCHF, tends to be one of the more active CHF crosses. It is fairing relatively well with a gain of 1.79%.
What happened on the chart?
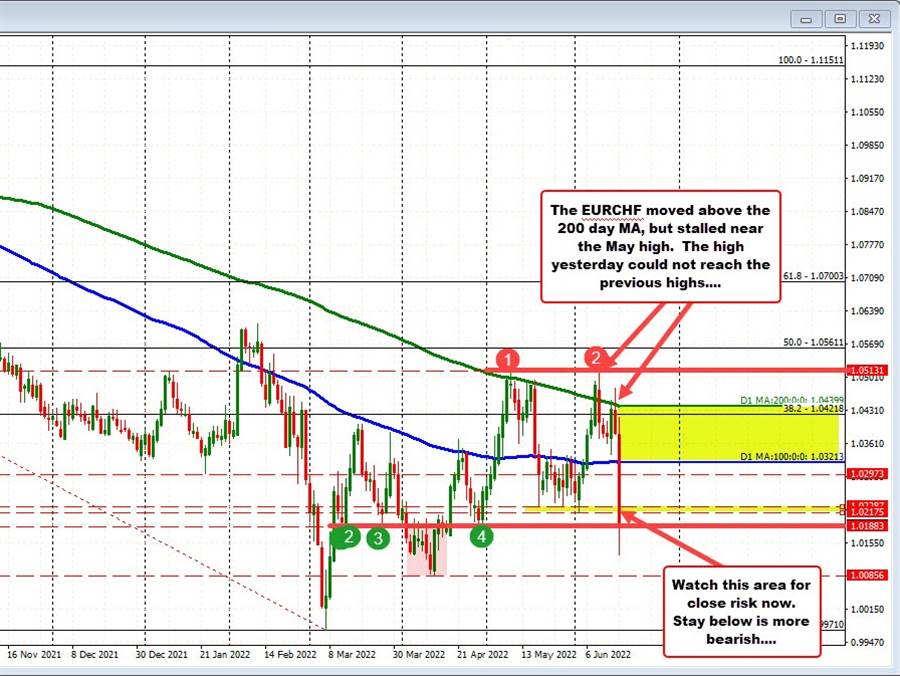
Looking at the daily chart below, the pair has been toying with moves above the 200 day MA (green line) at 1.04399 this month. There have been 3 bars where the price moved marginally above the MA, but only one daily close above the MA level (on June 8).
Today, the price gapped lower after the surprise hike, and away from the 200 day MA (green line). The price also quickly moved below the lower 100 day MA (blue line) at 1.03213. The continuation selling took the pair below the May lows near 1.02287 and the early June low at 1.0217. Finally, the pair also fell below the swing low from the end of April at 1.01883 to a low for the day at 1.01297.
What now?
The price has rebounded and trades modestly above the 1.01883, but remains below the May and early June lows at 1.0217 to 1.12287. That area will be eyed now as close risk. Stay below keeps the sellers in firm control. Move above, and there may some some further covering that takes the pair back higher.
On the downside, the low price from April reached to 1.00856. That level, followed by the natural support at parity (1.0000) followed by the 2022 low (which is the lowest level since 2015) at 0.9971, will all be eyed.
