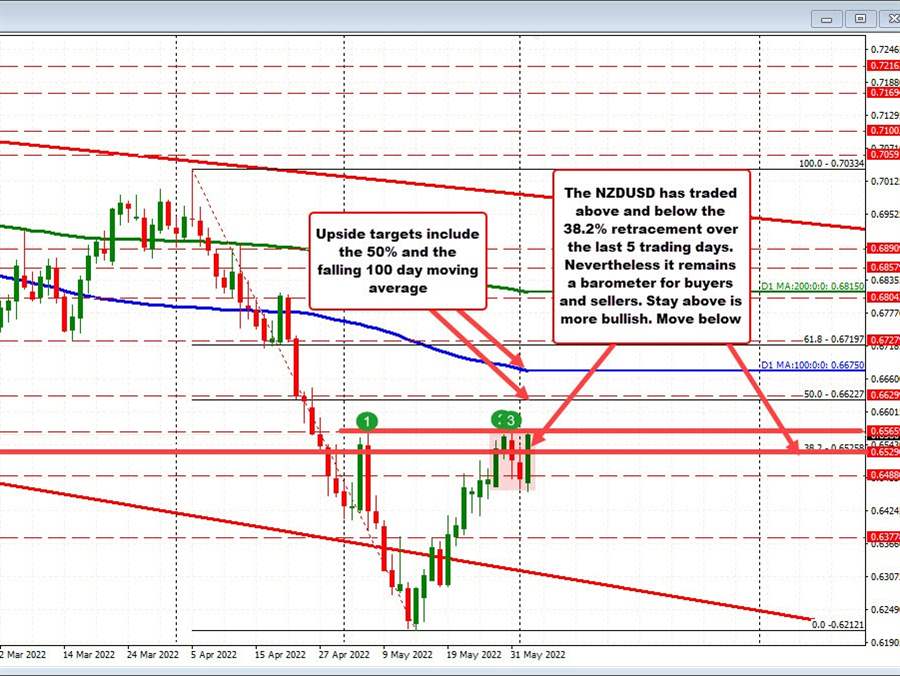
The NZDUSD has moved to the upside and in the process is retesting the swing high from Tuesday’s trade and the swing high going back to May 5. Those levels are at 0.6563 up to 0.65677.
The move to the upside has been strong. After reaching a low in the late Asian session that stalled ahead of the downside target near 0.6452, the price started to move back higher. The first key hurdle was the 200 hour moving average near 0.6491. The second was a break above the 100 hour moving average at 0.65202.
The high price just reached 0.6564. Get above the 0.65677 level and traders would start to target the 0.6580 to 0.6590 level.
Taking a broader look at the daily chart, the key risk level on the downside comes in at 0.65258. That represents the 38.2% retracement of the move down from the April high. It also was a swing low going back to January 28. The price over the last 5 trading days have traded above and below that level. Nevertheless, I consider the level a key barometer for buyers and sellers in the short-term. Stay above is more bullish. Move below is more bearish.
On the topside, the 50% midpoint of the same move down from the April high comes across at 0.66227.
