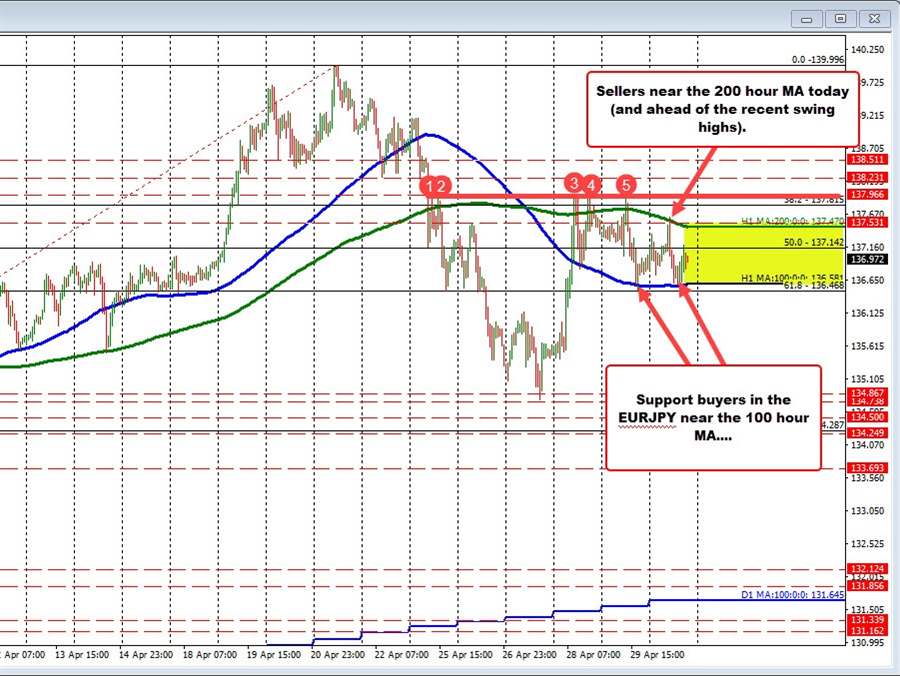
The EURJPY on Friday the moves to the upside or able to extend above the 200 hour moving average (green line in the chart above), but stalled against the swing highs from Thursday and also from intraday swing levels on Monday (see red numbered circles). That swing area came near 137.966.
On the downside, the low prices on both Thursday and Friday stalled near the 100 hour moving average (see blue line in the chart above). That moving average is currently at 136.581. On Friday I spoke to that range in the post here.
In trading today, the 200 hour moving average (green line) stalled the rally with early sellers ahead of the higher swing area at 137.966. On the downside today, the 100 hour moving average stalled the fall.
So buyers and sellers are leaning against the hourly moving averages (both on the topside and the downside) and playing that range, as traders await the next shove.
Look for momentum in the direction of the break. Currently, the price is trading near the lower extreme at 136.80. That is also below the 50% midpoint of the range since the April low (on April 5) tilting the bias marginally to the downside.
