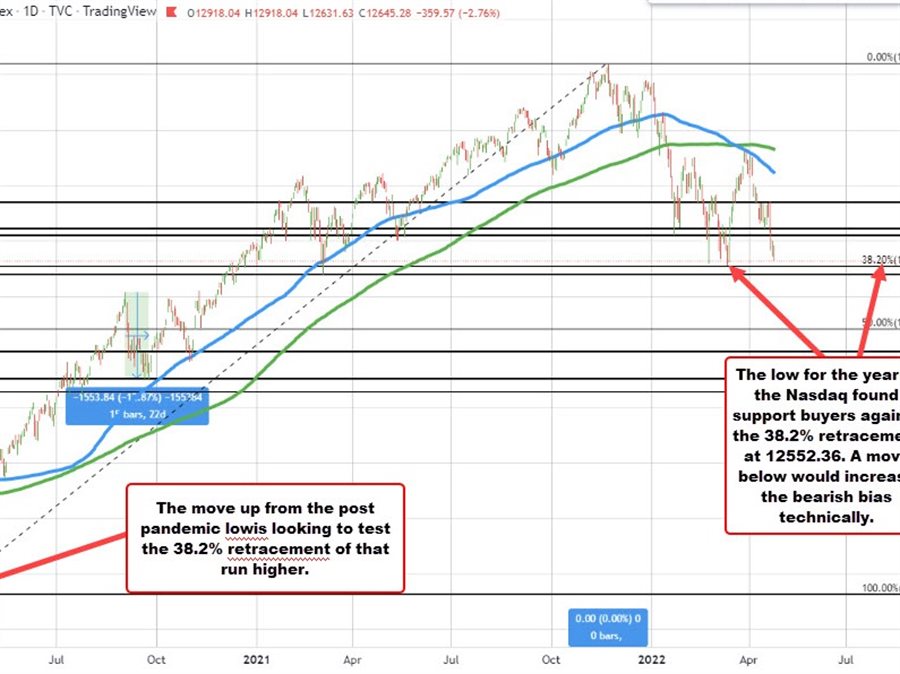
The NASDAQ index is a tumbling lower. It is currently down -356.76 points or -2.74% at 12648.10. The low price reached 12631.63. Looking at the daily chart, the swing low today has moved into the lower extreme area for 2020 which comes between 12555.35 and 12670.08.
The low price for the year was reached on March 14 after taking out the February 24 low at 12587.88 and quickly reversing higher. The price of the index from the year low moved up some 16.6% from over the next 11 trading days. The high price reached on March 29 tested its falling 100 day moving average, and found willing sellers.
Since then the index has moved down -13.76% over the last 19 trading days, and nearly retraced the entire move up. A move below the 2020 low would take the price to the lowest level since March 2021 when the price bottomed at 12397.05.
Taking a broader look going back to the post pandemic low, the 38.2% retracement of the move up from that low comes in at 12552.36 the low for the year at 12555.35 was just three points above that key retracement level. Move below would be more bearish.
.
