Yesterday, I posted about the
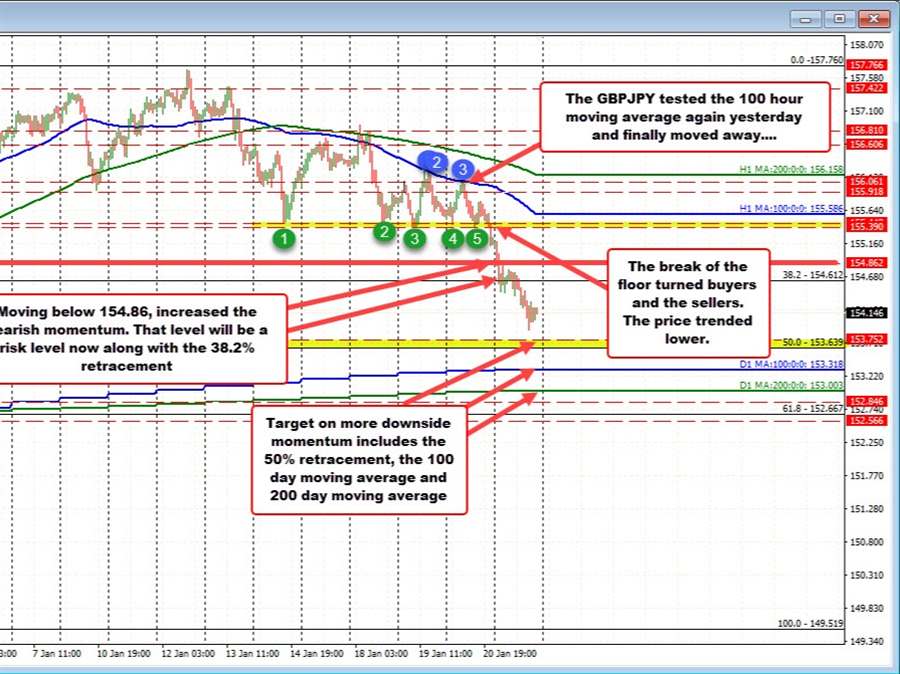
GBPJPY . The pair had continued to find support against a floor at the 155.39 to 155.44 area, but also found resistance against the falling 100 hour moving average (blue line in the chart above). Something had to eventually give, and that was the floor. Once the price broke below the floor at 155.39, buyers turned to sellers and the move to the downside was on.
The momentum took the price to a low today of 153.90 (149 pip fall). The pair approached a swing area and the 50% midpoint of the move up from the December 20 low between 153.639 and 153.752. The pair slowed ahead of that area, but will remain a target on more downside momentum. Also in play on the downside would be the 100 day moving average at 153.318 (lower blue line) and the 200 day moving average at 153.003 (lower green line on the chart above).
Close risk now would be the broken 38.2% retracement of the move up from the December 20 low at 154.612, also the old swing level around 154.862. Stay below those levels and the sellers remain more in control, at least in the short term.