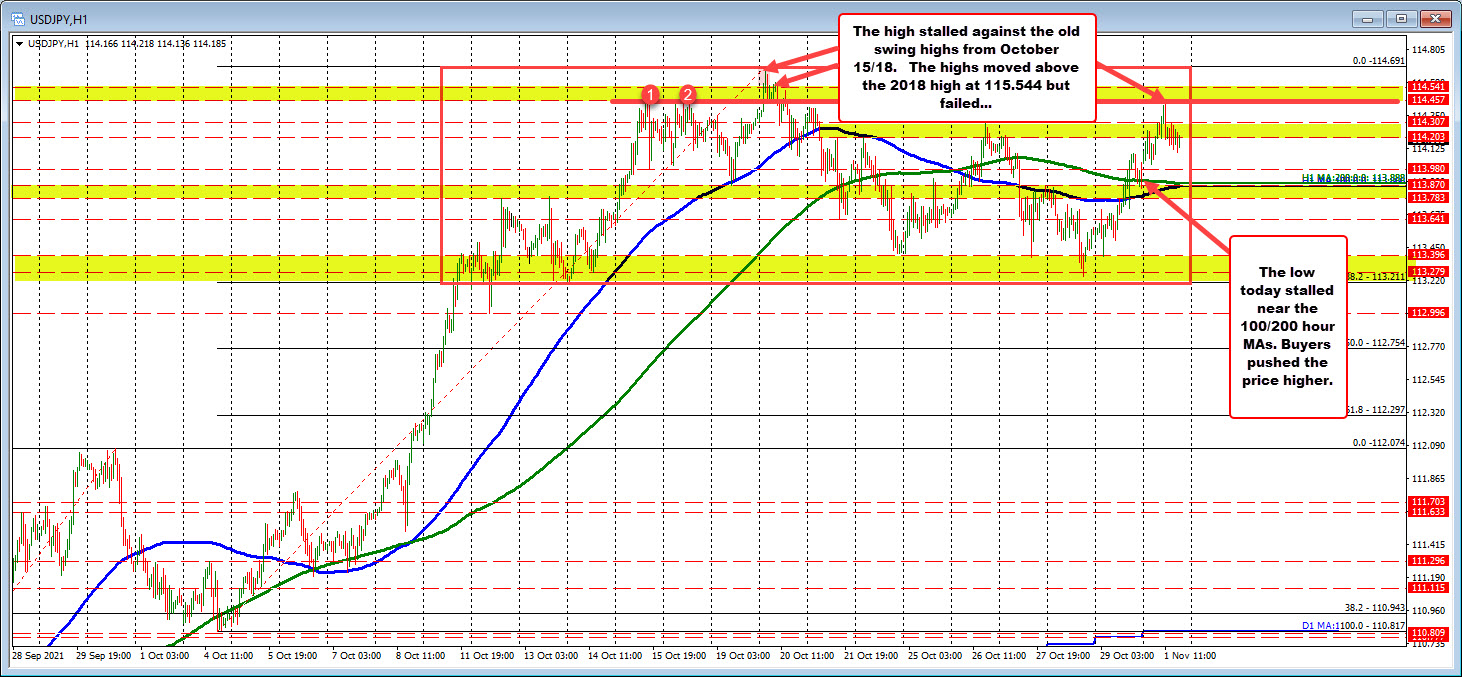
100 and 200 hour MAs at 113.88. 2018 swing high at 114.544 Current price between the levels
The USDJPY has moved higher on the day and in the process moved away from its now converged 100 and 200 hour moving averages near 113.888.
Those two moving averages have converged as the price consolidates between 113.21 and 114.69 (see red box). The price of the USDJPY has traded in that red box over the last 14 trading days. The aforementioned moving averages are converged between those extremes which is indicative of a non-trending market.
The move away from the moving averages to the upside increased the bullish bias. However, it still found resistance sellers near the 114.457 swing highs going back to October 15 and 18th and ahead of the 114.544 level which was the highest level going back to 2018 until the brief break on October 20 (see daily chart below).
The price currently trades at 114.20 which is between the aforementioned moving averages below, and the swing levels above (including the October 2017 high at 114.544).
So overall, the buyers today had their shot against the moving averages. They hit the initial target but have not been able to hit the harder targets to the upside.
The sellers are trying to shoot back against the upside resistance and did hit their initial target too by staying below the resistance levels. However, they have the MA targets.
