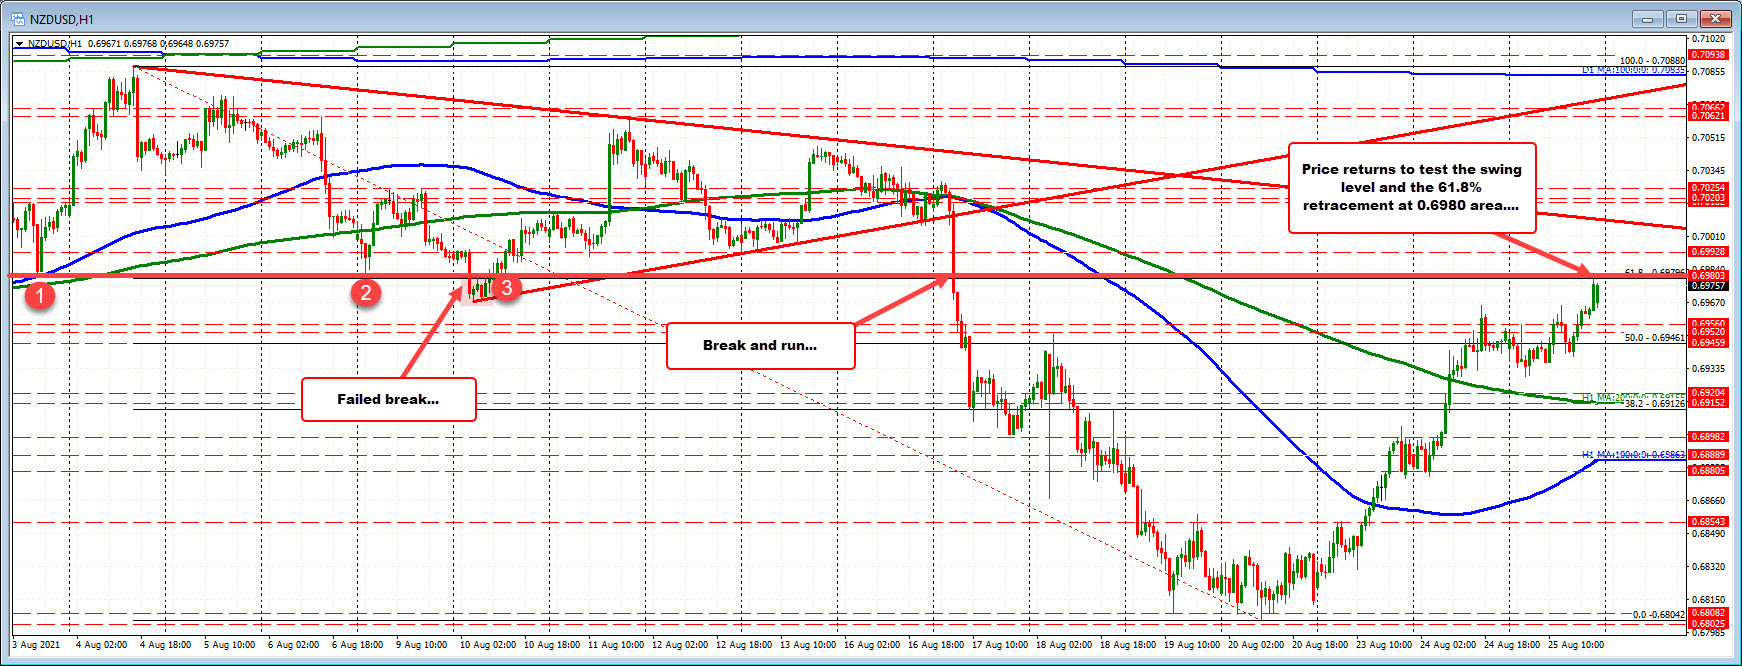
Level corresponds with the 61.8% retracement level
The NZDUSD is trading to new session highs for the day and in the process is testing a break level from last week’s trading and also the 61.8% retracement of the move down from the August high to the August low. Those levels come near 0.69796.
Looking at the hourly chart, on August 3 and again on August 9, the price came down to test the 0.6980 level and found buyers. On August 10, the price move below that level for six or so hours before failing and rebasing against the level. Fast-forward to August 17 last week, and after falling below a trendline and away from the 100/200 hour MAs as well, the 0.6980 level was broken again, but this time with momentum.
The high price today just reached 0.69789. Sellers leaned against it and the 61.8% retracement level. Risk can be defined and limited. Stay below and the sellers are ok. Move above and we could see those risk focused sellers covering.
This article was originally published by Forexlive.com. Read the original article here.
