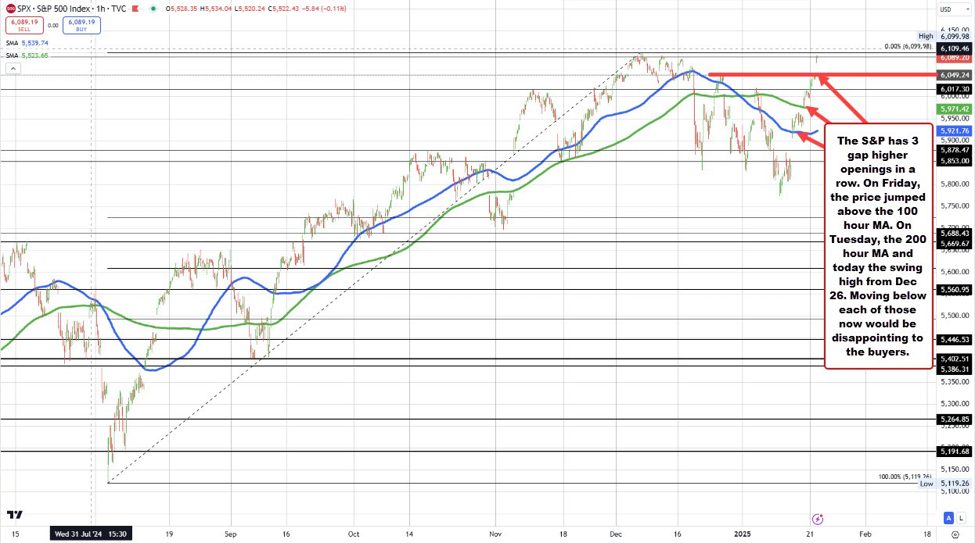
The S&P index moved to a high today of 6092.82. That move took the price of the index above the highest closing level at 6090.27. The all-time high price was not breached at 6099.98.
Technically speaking the price has gapped on the opening for the 3rd consecutive day.
- On Friday, the price gapped and broke above its 100 hour moving average (blue line on the chart above). Bullish.
- On Tuesday as traders returned from the Martin Luther King Day holiday on Monday and the presidential inauguration, the price once again gap. This time the price moved above its 200 hour moving average (green line in the chart above).. Bullish
- Today, the price gapped above a swing high from December 26 at 6049.24 extending toward the high closing level and the all-time high price in the process.
The price has backed off a bit and trades at 6085.24. That is still higher on the day, but back below the high close.
What would disappoint the buyers now and perhaps give the buyers additional cause for pause?
Close risk for traders would now be eyed at the
- Dec 26 high price at 6049.24 level, followed by the
- 200 hour moving average of 5971.42 and the
- 100 hour moving average of 5921.77.
Move below those levels would be disappointing for the buyers looking for new records to be broken and at the same time give the sellers some added confidence of more downside potential given the double top at all-time high levels. .
