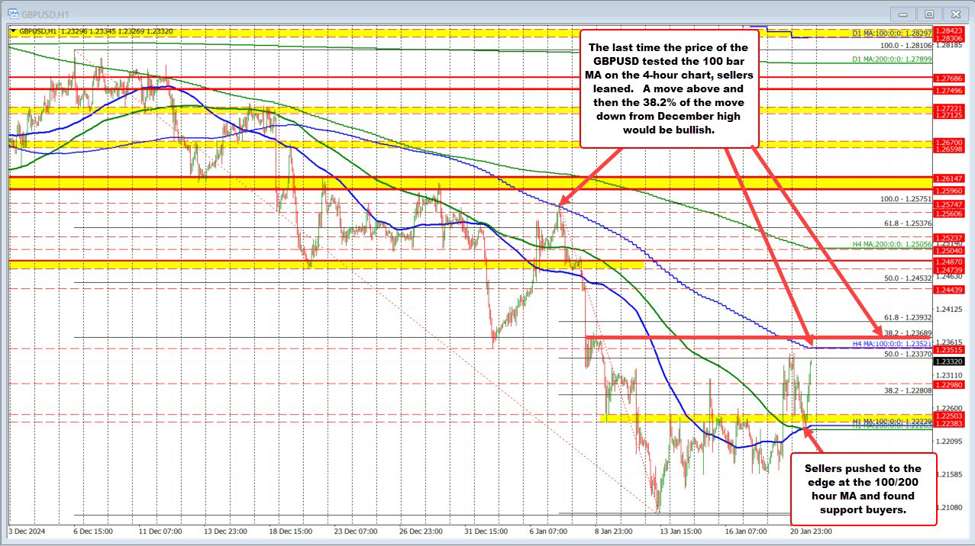
The GBP/USD moved lower during the Asian and European sessions but found support near the converged 100- and 200-hour moving averages (MAs). Sellers turned into buyers at this critical area, and the pair began to rotate back to the upside. The upward momentum has now pushed the price toward the 50% retracement level of the decline from the January high to the January low, located at 1.2337.
A break above this midpoint would bring the next key resistance into focus: the 100-bar MA on the 4-hour chart, currently at 1.2352. Notably, this MA previously stalled a rally on January 7, underscoring its significance today and in the days ahead. A sustained move above this level would signal further bullish potential.
Beyond that, traders would target the 38.2% retracement of the larger decline from the December high, which sits at 1.2369. This level represents another critical resistance point that would need to be cleared to reinforce a stronger bullish bias. For now, the focus remains on whether buyers can maintain momentum above these progressively important resistance levels.
