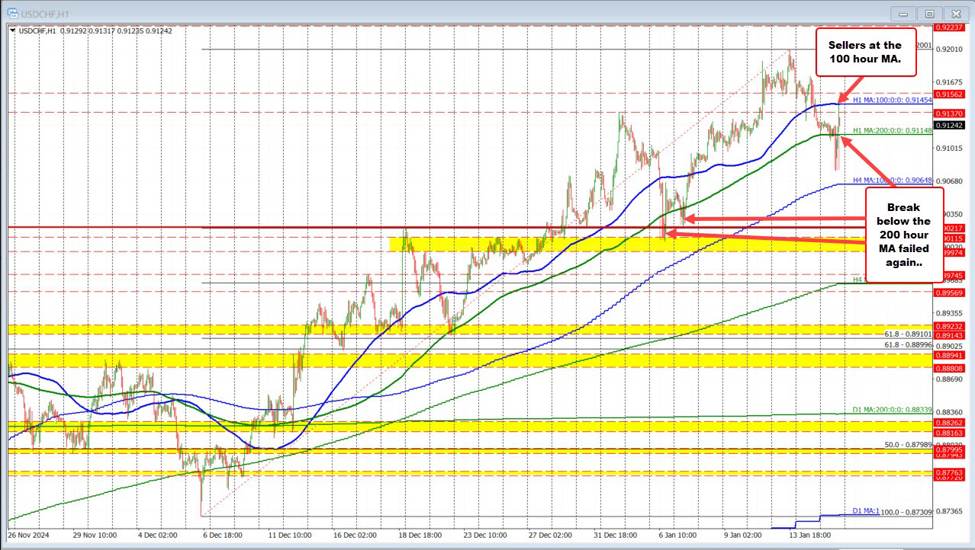
The USDCHF broke lower after the US CPI data.
Although yields moved lower in the US and remain down, they also moved lower in Europe. The dynamic saw the technicals switch from being more dollar bearish to more dollars bullish.
Looking at the USDCHF, the price fell below its 200-hour moving average (green line on the chart below at 0.91148) which was a shift more to the downside. However, the momentum stalled, the price started to rotate back higher, and when it returned back above its 200-hour moving average at 0.91148, sellers turned back to buyers.
The price rise moved up to the 100-hour moving average at 0.91454, where sellers returned once again.
What now?
The price is trading between the 200-hour moving average below at 0.91148, and the 100-hour moving average above at 0.91454. The battle is on between buyers and sellers between those levels. Move back below the 200 hour moving average and the tilt shift more in favor of the sellers at least in the short-term. Conversely move back above the 100 hour moving average at 0.91454, and that tilt moves to the upside.
