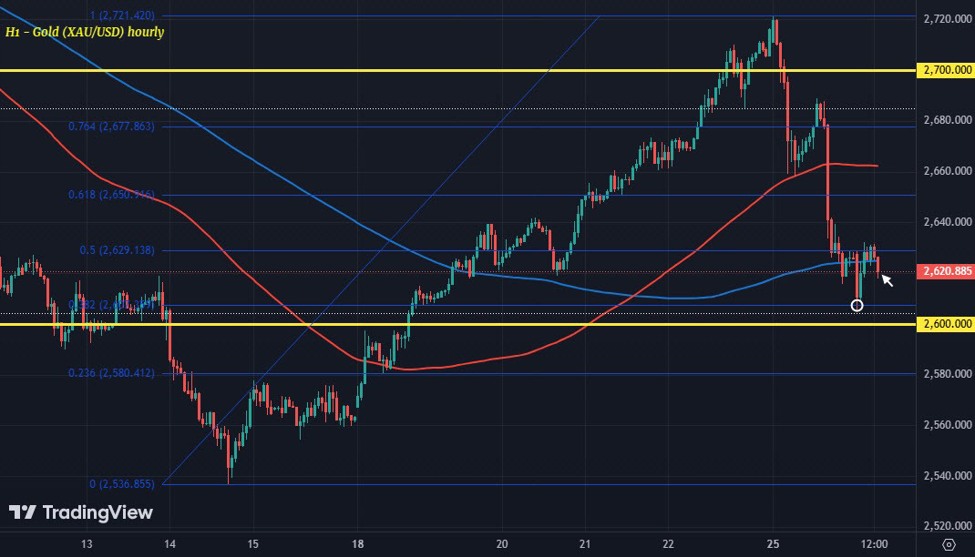
Gold (XAU/USD) hourly chart
The drop this week sees price take a tumble from $2,700 with the low earlier touching $2,605. That was held by the 38.2 Fib retracement level of the swing higher since the middle of November, seen at around $2,607 currently. That led to a slight bounce with price action then weaving in and out of the 200-hour moving average (blue line).
There continues to be a bit of a wrestle for near-term control as such ahead of European trading.
Hold below the key near-term level and sellers will retain a more bearish near-term bias. But push above and the near-term bias can be argued to be more neutral.
As much as the gold drop yesterday had to do with Bessent’s appointment as Treasury secretary, I want to say there’s a good deal of profit-taking as well. Gold has caught a modest bounce off its 100-day moving average since two weeks back but it comes after one of its steeper declines this year, following Trump’s election win.
Essentially, gold followed up on six straight days of losses with five straight days of gains. From a technical standpoint, it’s like a correction to the correction. And also helped by the bounce off the 100-day moving average at the time.
But as price is now caught in another downdraft, we might yet return back to a test of the 100-day moving average again. The key level is seen at $2,565.98 currently. That might offer something for sellers to target, if they can establish more control in the near-term as seen above.
All that before we start to switch the focus to a potentially more seasonal state of affairs as seen here.
