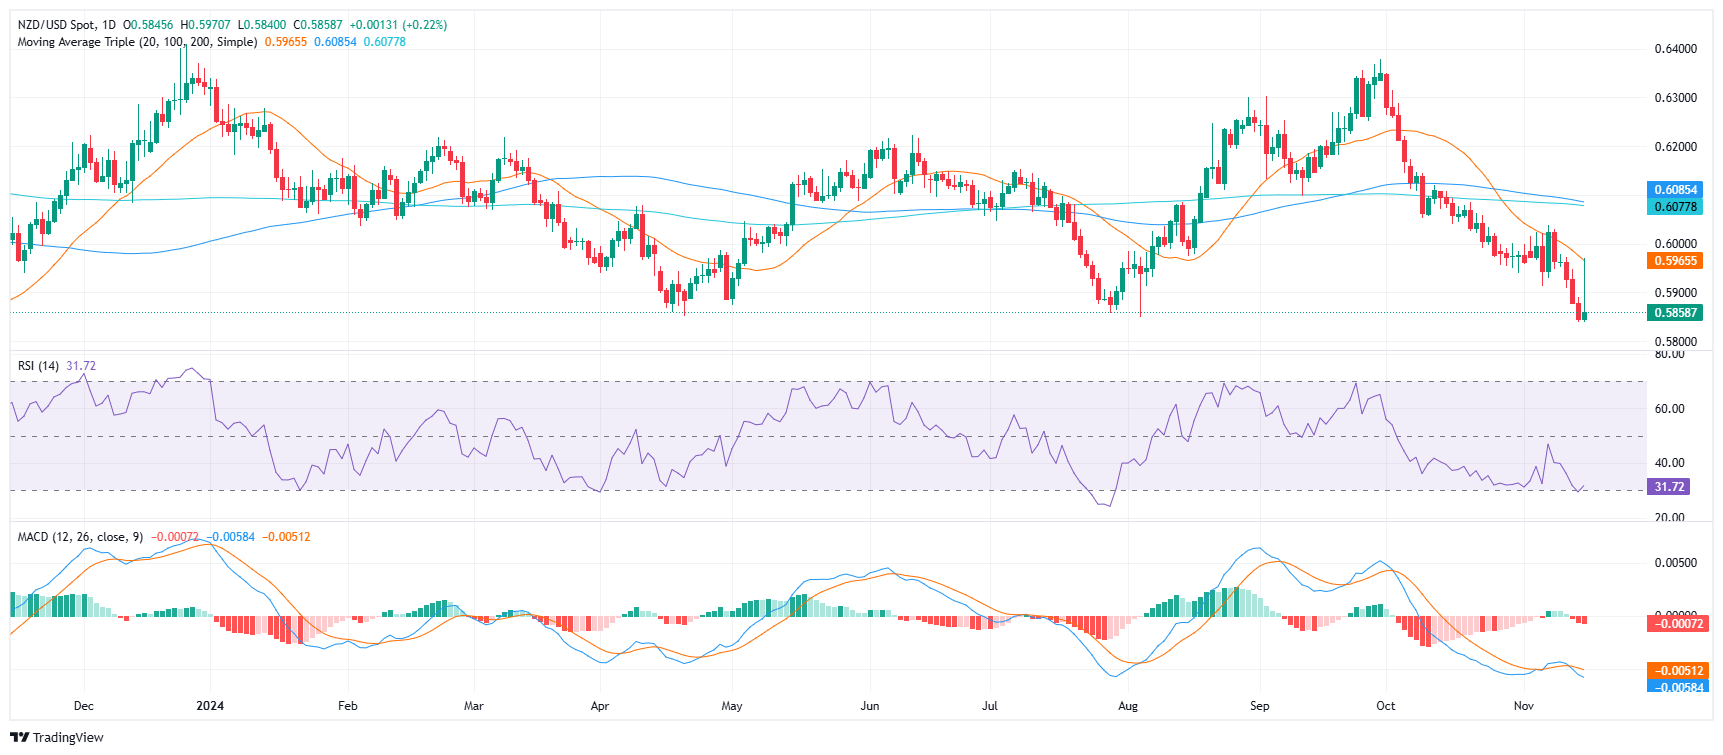
- NZD/USD pair traded volatile during Friday’s session, clearing all of its daily gains.
- Pair initially soared to a high around 0.5970 near the 20-day SMA before erasing all the gains towards 0.5850.
- The RSI signaled that buying pressure recovered as it neared the oversold area with a rise in slope.
The NZD/USD saw a volatile session on Friday, initially soaring to a high around 0.5970 near the 20-day Simple Moving Average (SMA) before erasing all the gains towards 0.5850. The pair mildly rose to 0.5855, indicating that the bulls have limited power and that the bears continue in command but a correction is on the horizon as indicators are near oversold levels.
The technical indicators currently depict a mixed outlook for the NZD/USD pair. The Relative Strength Index (RSI) suggests that buying pressure is recovering as it is approaching the oversold area and its slope is rising sharply. Conversely, the Moving Average Convergence Divergence (MACD) indicates that selling pressure is flat, as evidenced by the flat and red histogram. Despite these conflicting signals, the overall outlook remains tilted in favor of the bears.
Support levels can be found at 0.5900, 0.5850, and 0.5800, while resistance levels lie at 0.5950, 0.6000, and 0.6050.

