Fundamental
Overview
The S&P 500 rallied
into a new all-time high following Trump’s victory and the red sweep as the
market started to look forward to bullish drivers like tax cuts and
deregulation.
The only bearish reason
people were looking at was the rise in Treasury yields. That’s generally
bearish only when the Fed is tightening policy not when yields rise on positive
growth expectations.
Right now, the Fed’s
reaction function is that a strong economy would warrant an earlier pause in
the easing cycle and not a tightening. That should still be supportive for the
stock market.
If the Fed’s reaction
function changes to a potential tightening, then that will likely trigger a big
correction in the stock market on expected economic slowdown.
For now, the current
pullback looks as something healthy given the very strong rally following Trump’s
victory, so the dip-buyers should be happy about it.
S&P 500
Technical Analysis – Daily Timeframe
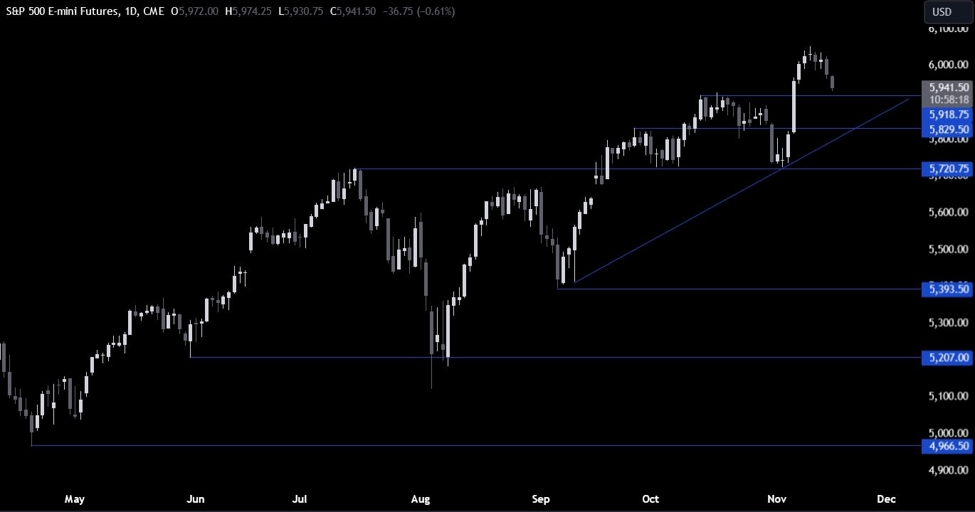
S&P 500 Daily
On the daily chart, we can
see that the S&P 500 is pulling back to the key support level around the previous all-time high at 5927.
This is where we can expect the buyers to step in with a defined risk below the
level to position for a rally into a new all-time high. The sellers, on the
other hand, will want to see the price breaking lower to increase the bearish
bets into the trendline
around the 5800 level.
S&P 500 Technical
Analysis – 4 hour Timeframe
S&P 500 4 hour
On the 4 hour chart, we can
see that we have a 38.2% Fibonacci
retracement level standing right around the support level. This should
technically strengthen the support and give the buyers a good level where to
lean at and protect their stops. The sellers will look for a break lower to
increase the bearish momentum into the trendline.
S&P 500 Technical
Analysis – 1 hour Timeframe
S&P 500 1 hour
On the 1 hour chart, we can
see that we have a minor downward trendline defining the current pullback. The
sellers will likely continue to lean on it to position for new lows, while the buyers
will look for a break higher to increase the bullish bets into new highs. The
red lines define the average daily range for today
Upcoming
Catalysts
Today we conclude the week with the US Retail Sales report.
