Fundamental
Overview
The US Dollar is now lower
across the board as the market erased most of the greenback’s gains following
Trump’s victory. This has been a puzzling reaction as Trump’s policies are
likely to spur growth and potentially end the Fed’s easing cycle earlier than
expected.
We can argue that the
market was already positioned for a Trump’s victory as we saw the greenback
rallying for a couple of weeks leading into the US election. So, this might
just be a “sell the fact” reaction and the market might now need more to keep
bidding the USD.
Another possible
explanation is that the market is more focused on global growth now and that’s
generally bearish for the greenback. We saw something similar in 2016 when the
USD rallied strongly once Trump got elected but after a couple of months, it went
into a 2-year long downtrend.
The Fed for now remains
neutral and on track to keep cutting rates. Yesterday, they cut by 25 bps as expected and given the overall neutral
message, the market expects another 25 bps cut in December. Strong data from
now until the December meeting though could change their plans for 2025.
We have the US CPI report
next week and that’s going to be a test. If the US Dollar sells off on hot
data, then the market might be indeed focusing on global growth rather than the
potential for an earlier pause in the Fed’s easing cycle.
NZDUSD
Technical Analysis – Daily Timeframe
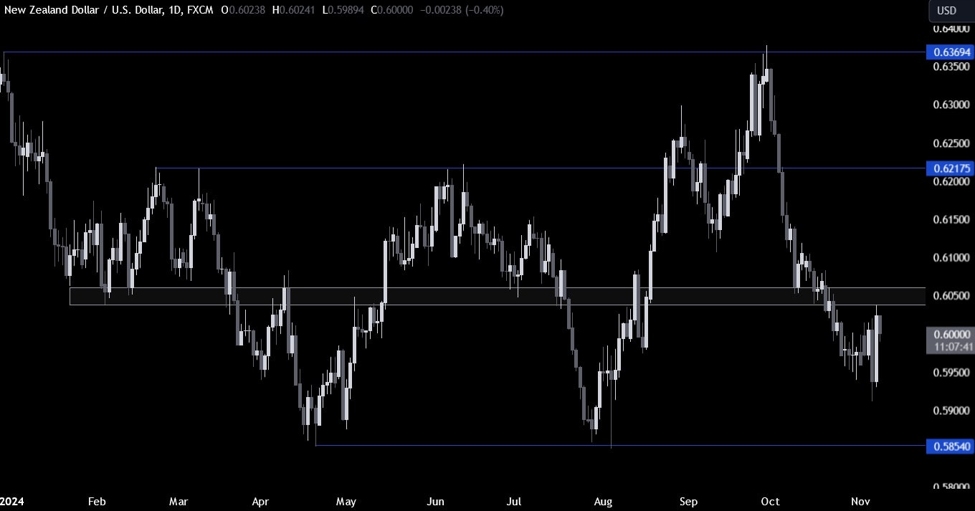
NZDUSD Daily
On the daily chart, we can
see that NZDUSD after a spike lower on Trump’s victory, reversed higher to test
the key resistance
zone around the 0.6050 level. This is where the sellers are stepping in to
position for a drop into the 0.5850 level next. The buyers, on the other hand,
will want to see the price breaking higher to increase the bullish bets into
the 0.6217 resistance next.
NZDUSD Technical
Analysis – 4 hour Timeframe
NZDUSD 4 hour
On the 4 hour chart, we can
see more clearly the recent price action with the price rejecting the key
resistance zone. There’s not much more we can add here so we need to zoom in to
see some more details.
NZDUSD Technical
Analysis – 1 hour Timeframe
NZDUSD 1 hour
On the 1 hour chart, we can
see that we have an upward trendline
defining the current bullish momentum and a support zone around the 0.5975
level where we can also find the 61.8% Fibonacci
retracement level for confluence.
If the price gets there, we
can expect the buyers to step in with a defined risk below the trendline to
position for the break above the resistance. The sellers, on the other hand,
will want to see the price breaking lower to increase the bearish bets into new
lows. The red lines define the average daily range for today.
Upcoming
Catalysts
Today we conclude the week with the University of Michigan Consumer Sentiment
report.
