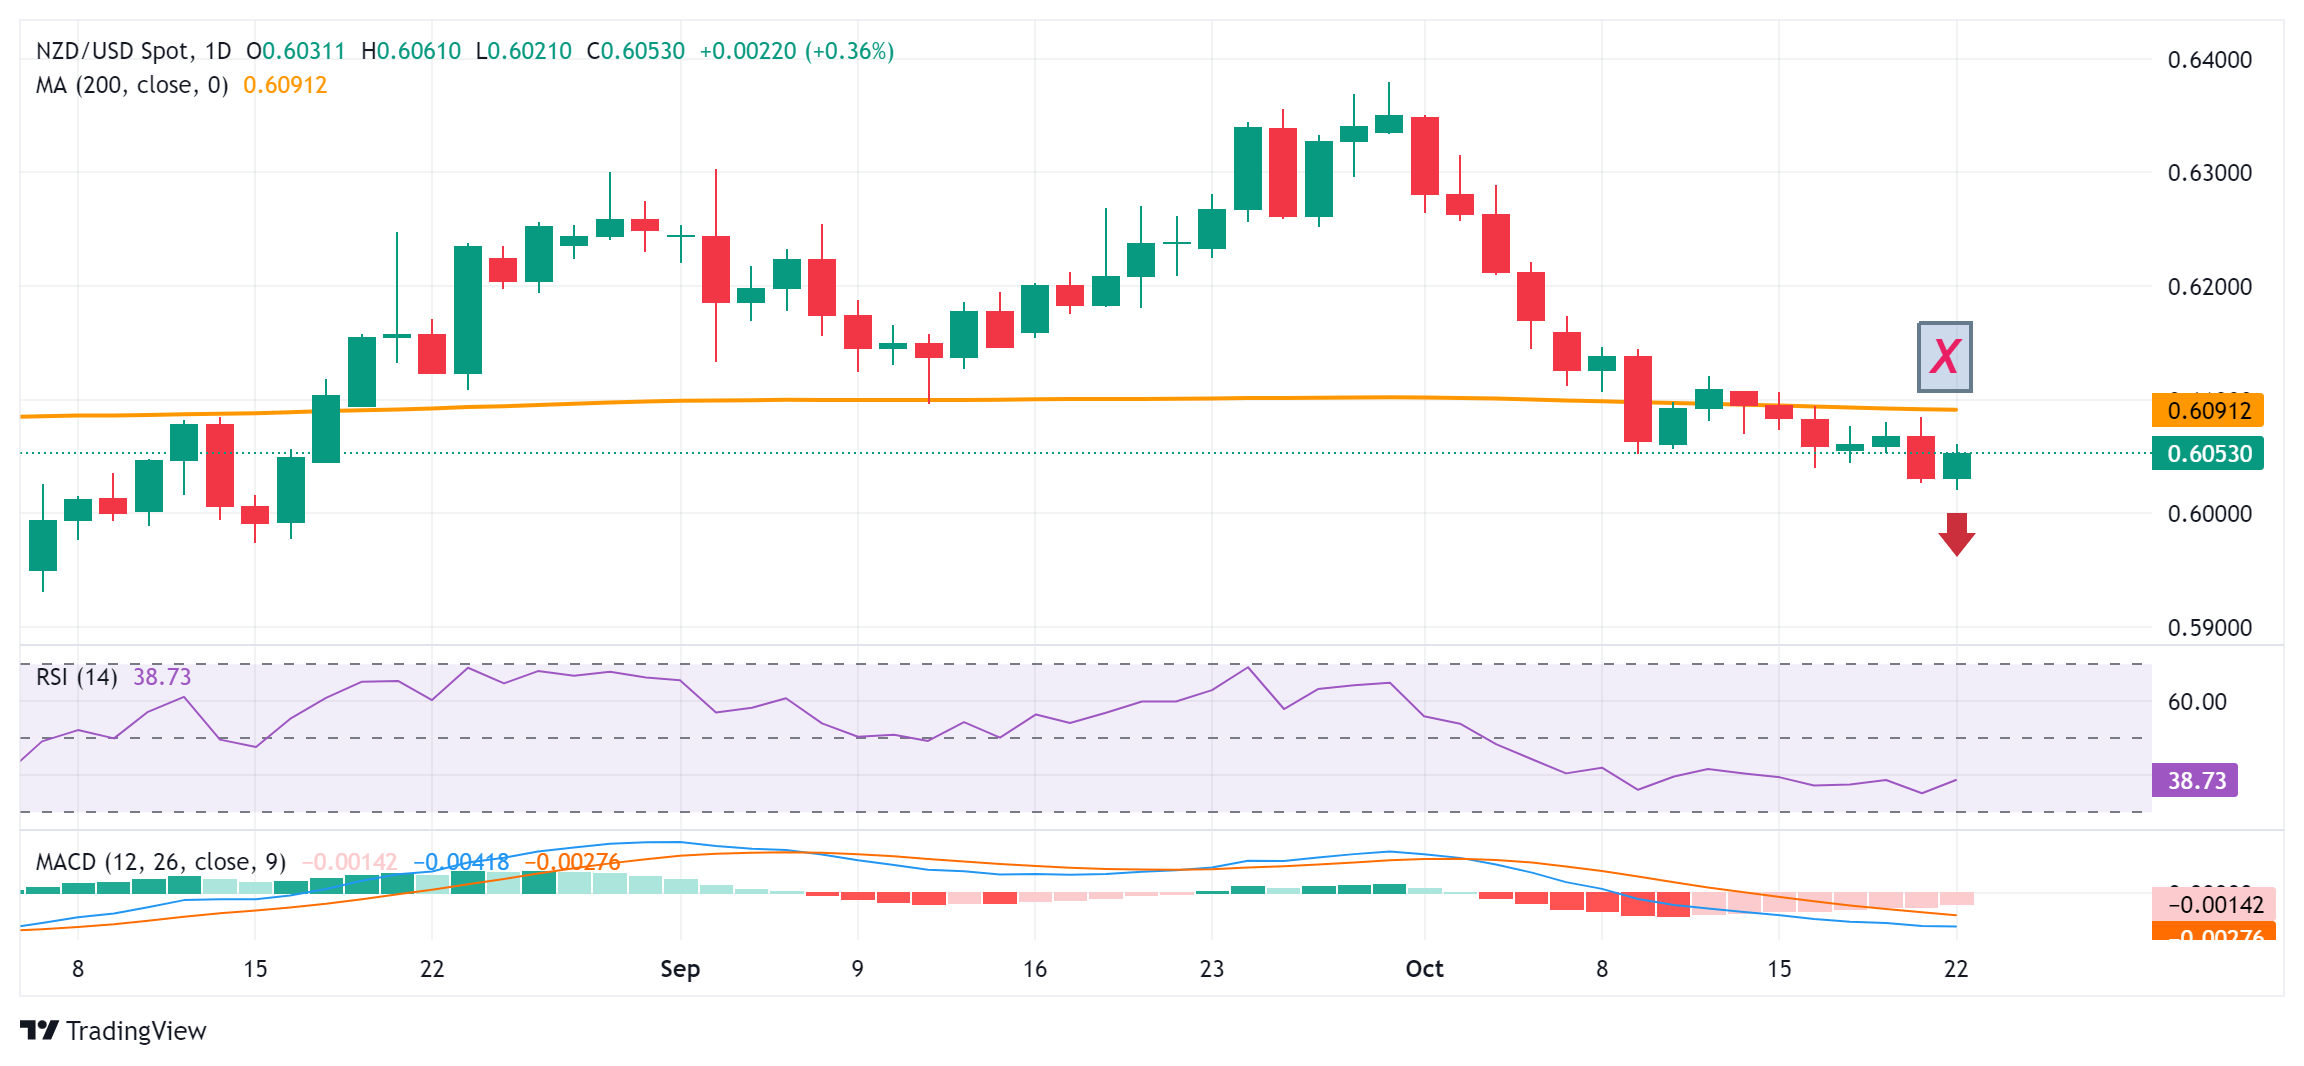
- NZD/USD rebound from over a two-month low amid a modest USD downtick.
- A combination of factors should limit the USD slide and cap gains for the pair.
- The setup supports prospects for the emergence of fresh selling at higher levels.
The NZD/USD pair stages a modest recovery from the 0.6020 area, or its lowest level since August 16 touched this Tuesday and sticks to its intraday gains through the first half of the European session. Spot prices currently trade around the 0.6060 region, up 0.45% for the day, and draw support from a weaker US Dollar (USD).
The USD Index (DXY), which tracks the Greenback against a basket of currencies, eases from its highest level since early August as bulls take a breather following the recent strong rally since the beginning of this month. However, growing acceptance that the Federal Reserve (Fed) will proceed with modest rate cuts should limit any meaningful USD corrective slide. This, along with expectations that the Reserve Bank of New Zealand (RBNZ) will cut rates aggressively and a softer risk tone, should cap gains for the risk-sensitive NZD/USD pair.
From a technical perspective, the recent breakdown below the very important 200-day Simple Moving Average (SMA) was seen as a fresh trigger for bearish traders. Moreover, oscillators on the daily chart are holding deep in negative territory and are still away from being in the oversold territory. This, in turn, suggests that the path of least resistance for the NZD/USD pair is to the downside. Hence, any subsequent move up might still be seen as a selling opportunity near the 0.6100 round-figure mark, which should now act as a key pivotal point.
The said barrier is followed by the 0.6120-0.6125 supply zone, which if cleared decisively will suggest that spot prices have formed a near-term bottom and pave the way for additional gains. The NZD/USD pair might then aim to clear the 0.6175-0.6180 intermediate barrier and reclaim the 0.6200 round-figure mark before climbing further towards the next relevant hurdle near the 0.6230-0.6235 region.
On the flip side, the 0.6025-0.6020 region, or the daily trough, might continue to protect the immediate downside ahead of the 0.6000 psychological mark. A convincing break below the latter will reaffirm the negative outlook and drag the NZD/USD pair to the 0.5950 horizontal support. The downward trajectory could extend further towards the 0.5930 intermediate support en route to sub-0.5900 levels and the August monthly swing low, around mid-0.5800s.
NZD/USD daily chart
US Dollar PRICE Today
The table below shows the percentage change of US Dollar (USD) against listed major currencies today. US Dollar was the strongest against the Japanese Yen.
| USD | EUR | GBP | JPY | CAD | AUD | NZD | CHF | |
|---|---|---|---|---|---|---|---|---|
| USD | -0.13% | -0.09% | 0.11% | 0.00% | -0.33% | -0.37% | -0.07% | |
| EUR | 0.13% | 0.04% | 0.23% | 0.12% | -0.23% | -0.23% | 0.05% | |
| GBP | 0.09% | -0.04% | 0.20% | 0.09% | -0.26% | -0.28% | 0.02% | |
| JPY | -0.11% | -0.23% | -0.20% | -0.10% | -0.44% | -0.48% | -0.17% | |
| CAD | 0.00% | -0.12% | -0.09% | 0.10% | -0.33% | -0.37% | -0.06% | |
| AUD | 0.33% | 0.23% | 0.26% | 0.44% | 0.33% | -0.04% | 0.26% | |
| NZD | 0.37% | 0.23% | 0.28% | 0.48% | 0.37% | 0.04% | 0.30% | |
| CHF | 0.07% | -0.05% | -0.02% | 0.17% | 0.06% | -0.26% | -0.30% |
The heat map shows percentage changes of major currencies against each other. The base currency is picked from the left column, while the quote currency is picked from the top row. For example, if you pick the US Dollar from the left column and move along the horizontal line to the Japanese Yen, the percentage change displayed in the box will represent USD (base)/JPY (quote).

