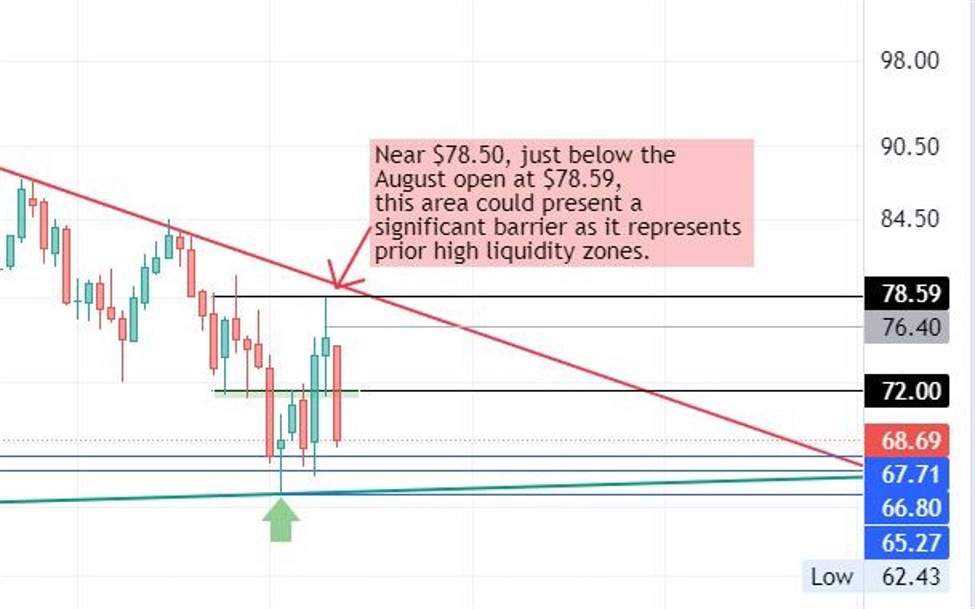
📉 Crude Oil Futures (CL1!) are showing clear signs of bearish momentum, with prices falling sharply in recent weeks. This is reflected in the weekly chart, where the market has consistently respected a long-term descending resistance line (marked in red as the bottom of the triangle) stretching back to the highs seen in 2022.
Key Technical Levels to Watch for Oil:
- Current Price: $68.69 (as of the latest close, down -2.80%)
- Resistance at $78.50: The August 2023 open, just below $78.59, represents a critical resistance area. This level is near prior high liquidity zones and has proven to be a key barrier for crude oil prices, pushing back bullish attempts to rally.
Support Levels in Focus:
-
$67.75 Support Zone: Currently, bears are pusheing prices toward this next key support level – pobably to be tested next. Breaking below $67.75 could open the door for another leg down, with additional targets below.
-
Further Downside Targets:
- $66.80: A key level being eyed by traders as a potential stopping point after breaking through $67.75.
- $65.27: If selling pressure continues, this lower support could come into play. Any sustained breach of this zone would likely signify a more significant bearish trend. However, a sustained break down is less likely and even if oil price pierces down the big triangle, expect a bullish reversal.
Bearish Momentum and Indicators:
-
The descending red trendline has acted as firm resistance, indicating that sellers remain in control. Multiple attempts to break above this line have failed, leading to the recent retest of lower levels.
-
The sharp 9.09% weekly decline highlights increased selling pressure. Unless bulls can defend these key support levels, the bearish outlook remains intact.
Possible Scenarios Moving Forward:
-
Bullish Reversal: For a bullish case to emerge, crude oil would need to break decisively above the $78.50 area. However, given the recent failure to sustain upward momentum, this scenario looks less likely in the short term.
-
Continuation of Bearish Trend: If the $67.75 support gives way, crude oil could quickly test lower levels at $66.80 and beyond. Any break below $65.27 would solidify a deeper bearish trend, potentially targeting even lower price points as sellers continue to dominate.
So, what should oil traders expect:
Bears remain firmly in control of crude oil futures, and the market is teetering on the edge of a critical support level. Traders should keep a close eye on $67.75, as a breakdown here could lead to further declines. On the flip side, any reversal that pushes prices back above $78.50 would shift the momentum back toward the bulls. For now, the path of least resistance appears to be lower, so caution is advised.
Trade carefully, and stay tuned for more updates from ForexLive.com for additional perspectives and insights! Always trade oil at your own risk only.
Zooming in on the crude oil weekly chart. Full chart below.
ForexLive.com crude oil futures forecast – weekly chart
