Fundamental
Overview
The USD remains under
pressure amid the aggressive market pricing for rate cuts and better global
growth expectations following the recent huge Chinese easing measures. It’s now
a battle between global growth supporting the risk sentiment and weighing on
the greenback and the aggressive rates pricing which could be scaled back if
the US data starts to pick up.
On the EUR side, the market
has basically fully priced in a back-to-back cut in October from the ECB
following the latest weak Eurozone
PMIs and “leaks” of ECB officials being open
for a rate cut in October. The expectations were reinforced further this
morning following the soft French
and Spain
CPI figures.
EURUSD Technical
Analysis – Daily Timeframe
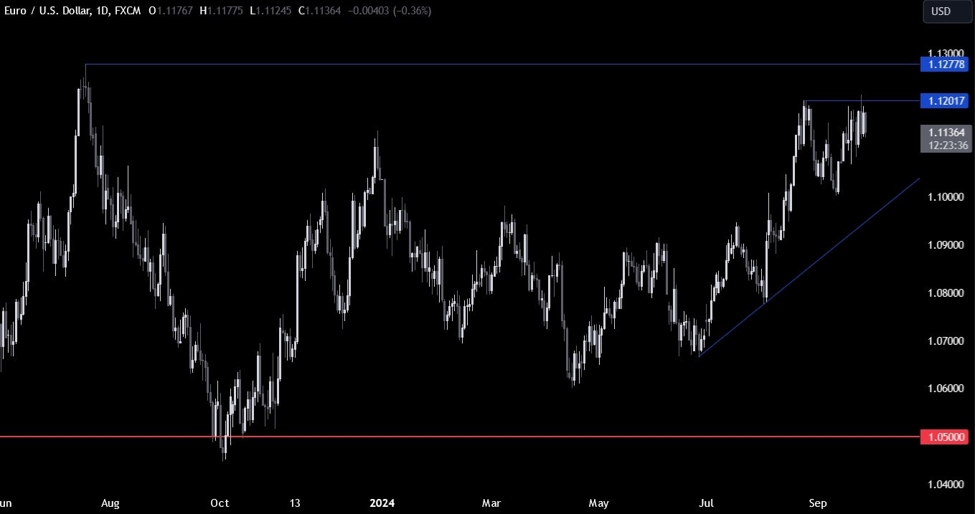
EURUSD Daily
On the daily chart, we can
see that EURUSD got rejected once again around the 1.12 handle. The sellers
stepped in with a defined risk above the level to position for a drop into the
major trendline.
The buyers, on the other hand, will want to see the price breaking higher to
increase the bullish bets into the 1.13 handle next or wait to buy the dip
around the trendline.
EURUSD Technical
Analysis – 4 hour Timeframe
EURUSD 4 hour
On the 4 hour chart, we can
see that we have another minor trendline defining the current bullish momentum.
The buyers will likely keep on leaning on the trendline to position for a break
above the 1.12 resistance.
The sellers, on the other hand, will want to see the price breaking lower to
increase the bearish bets into the major trendline.
EURUSD Technical
Analysis – 1 hour Timeframe
EURUSD 1 hour
On the 1 hour chart, there’s
not much we can add as buyers will look to buy the dip around these levels,
while the sellers will look for a break below the trendline and the 1.1120
level to increase the bearish bets into new lows. The red lines define the average daily range for today.
Upcoming
Catalysts
Today, we conclude the week with the US PCE report.
