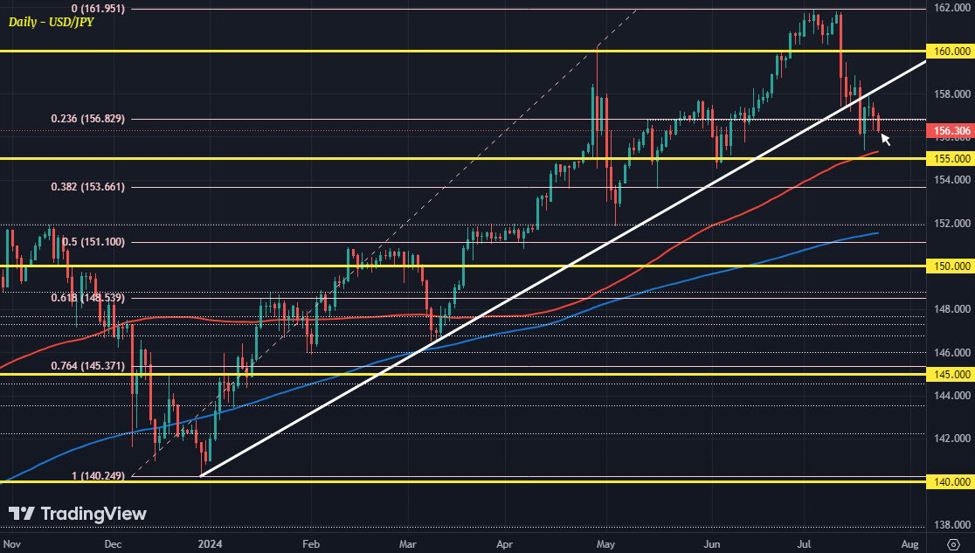
The retreat comes again as we get to the handover from Asia to Europe, somewhat similar to yesterday. Sellers are staying interested with price action keeping below the broken trendline support (white line) as seen below:
USD/JPY daily chart
The 100-day moving average (red line) at 155.31 currently will be a key downside target to watch.
Looking at the near-term chart, we can see how sellers are also dictating the state of play at the moment:
USD/JPY hourly chart
The bounce last week was thwarted by sellers leaning on the broken trendline support, now acting as a key resistance line. After, they have been holding price action just below the 100-hour moving average (red line). And that suggests a more bearish near-term bias in the pair, at least for now.
The low last week at 155.50 will be the next layer to chew through before getting to the 100-day moving average as noted above.
There’s not much of a catalyst driving the move lower in USD/JPY to start the new week. Treasury yields were down slightly yesterday but recovered to push higher, though 10-year yields are back down by 2.3 bps to 4.236% now.
It looks to be just some yen buying flows as dip buyers have lost some of their luster after the recent Japan intervention.
