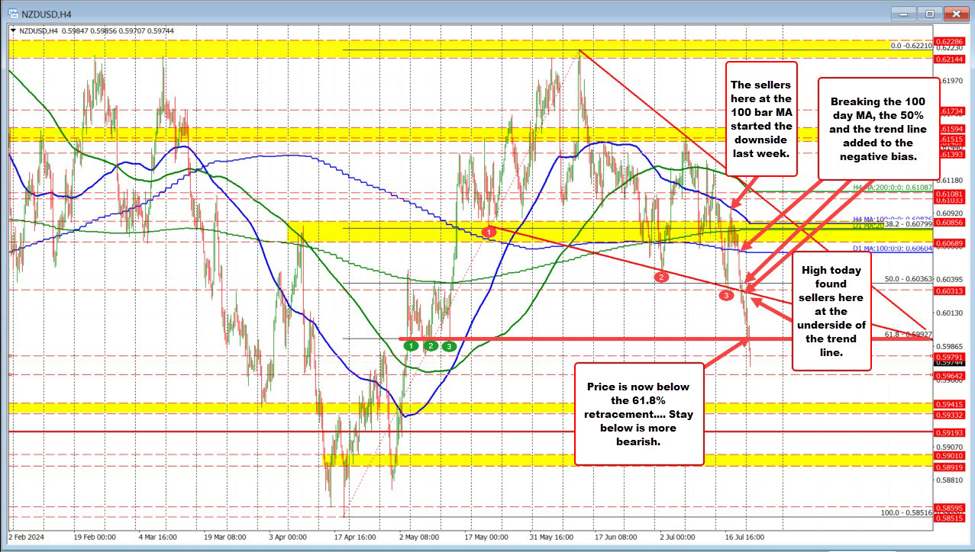
NZDUSD continues the run lower
The NZDUSD has continued its run lower (SEE CHART ABOVE) started last week after the pair initially found resistance against its
- 100 bar moving average on the 4-hour chart (higher blue line at 0.6082 at the time),
- 100-day moving average at 0.6060,
- 50% midpoint of the move up from the April low at 0.60363
- Downward sloping trend line (at 0.6031)
In today’s trading, the price initially moved higher, reaching a peak of 0.60269 in the first hour, testing the underside of a broken trend line where sellers leaned. The price then rotated lower, recently breaching the 61.8% retracement of the move up from the April low at 0.59927, with the current low set at 0.59707.
The 61.8% retracement level (at 0.59927) now serves as a close risk level for sellers; staying below it is more bearish. A move back above this level could lead to a rotation higher, indicating a failed break lower. Otherwise, the downside probing can continue.
Fundamentally, China’s influence impacts both the NZDUSD and AUDUSD. The PBOC’s rate cuts in response to weaker economic conditions have not helped these currencies, given their reliance on China for growth. Commodities are also trending down, with gold down 0.49% and crude oil down around $0.50. Finally, both the Trump and potentially the Harris administration could continue to put pressure on China economically. The Biden administration has imposed selling restrictions US chips to China on security concerns. Trump is intent on raising tariffs on China goods to help the competitiveness of US businesses.
Meanwhile, the AUDUSD is also moving lower, testing its 38.2% retracement of the move up from the April low at 0.66316. A swing area between 0.6618 and 0.66279, along with the rising 100-day moving average of 0.66057(see lower blue line on the chart below), are downside targets on a break of the 0.66316 level. Earlier today, the upward-sloping trend line, and the 200 bar moving average on the 4- hour chart (green line on chart below at 0.66789) were broken opening the door for downside momentum.
AUDUSD moves lower and tests the 38.2%
