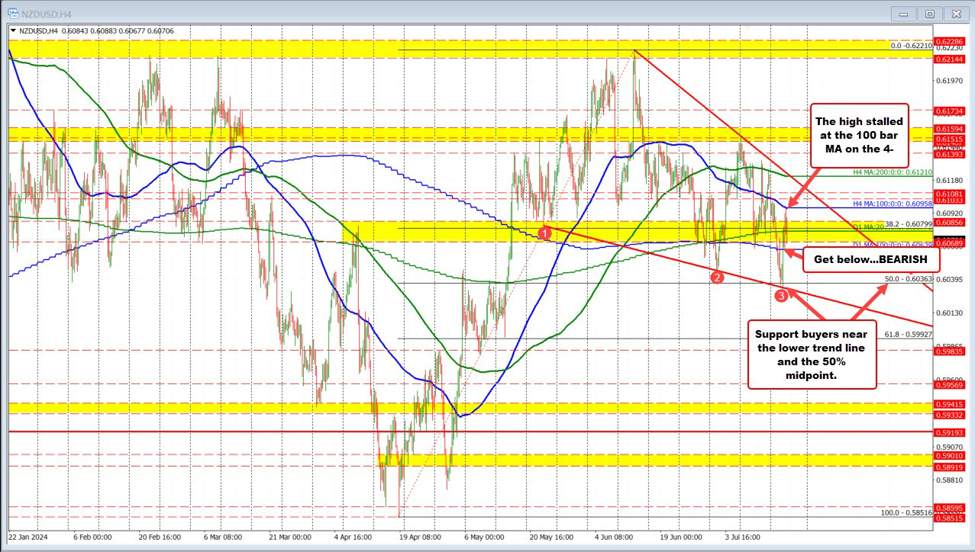
The NZDUSD fell sharply yesterday and in the process tested the 50% midpoint of the move up from the April low and also a trendline support level on the 4-hour chart.
The subsequent bounce off of the USD selling has in the price extend above the
- 100 day moving average at 0.60629,
- 200 day moving out of 0.60778, and up to its
- 100 bar moving average on the 4-hour chart and 0.60958.
Sellers leaned against that last target at 0.60958, the price has since rotated back below the 200-day moving average, but above the 100 day moving average.
So the technical bias is somewhat neutral between the MA cluster but has a small tilt to the downside. Get below the 100 day moving average and 0.60629 and the sellers are more firmly in control.
To hear all about it, click on the short video.
GBPUSD respects MAs
This article was originally published by Forexlive.com. Read the original article here.
