Fundamental
Overview
The USD continues to be
backed by good economic data as we have also seen recently from the US PMIs last Friday and the US Consumer Confidence report this week. Although such
data keeps the interest rates expectations stable around two cuts by the end of
the year, it should also support the risk sentiment amid a pickup in growth.
This could be a headwind for the greenback.
The CHF, on the other hand,
weakened after the SNB cut interest rates by 25 bps to 1.25%. The market was
pricing a 68% chance of a cut going into the decision, so it wasn’t really a
surprise. The central bank also lowered its inflation forecasts though, so that
added to the Swiss Franc weakness.
The only thing bullish for
the CHF was the line saying that the SNB “will be ready to intervene in FX
market if needed and as necessary”, although we already know that, and they
won’t do it unless inflation surprises to the upside or they see risks of
inflation overshooting their projections.
USDCHF
Technical Analysis – Daily Timeframe
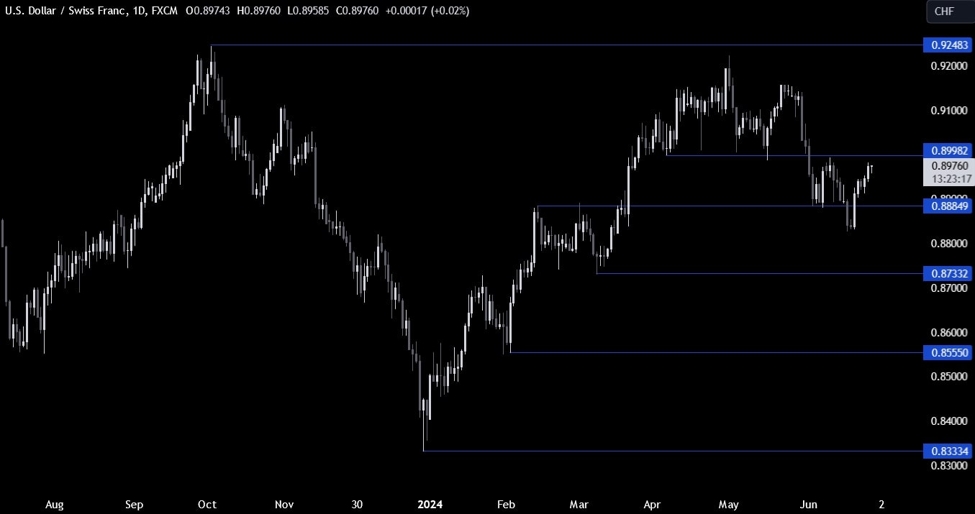
USDCHF Daily
On the daily chart, we can
see that USDCHF is approaching a key resistance around the 0.90 handle. That’s
where we can expect the sellers to step in with a defined risk above the level
to position for a drop into new lows. The buyers, on the other hand, will want
to see the price breaking higher to increase the bullish bets into the highs.
USDCHF Technical Analysis – 4 hour Timeframe
USDCHF 4 hour
On the 4 hour chart, we can
see that we have also the 50% Fibonacci
retracement level adding confluence to the resistance level. If we get
an upside breakout, the next target should be the trendline
around the 0.9050 level, which is also where we will likely find the sellers piling
in for a drop into new lows.
USDCHF Technical Analysis – 1 hour Timeframe
USDCHF 1 hour
On the 1 hour chart, we can
see that if we were to get a pullback, the buyers will likely lean on the support
zone around the 0. 8945 to position for a breakout with a better risk to reward
setup. The sellers, on the other hand, will want to see the price breaking
lower to increase the bearish bets into new lows. The red lines define the average daily range for today.
Upcoming
Catalysts
Today we get the latest US Jobless Claims figures, while tomorrow we conclude
the week with the US PCE report.
