Fundamental
Overview
The USD continues to be
backed by good economic data as we have also seen recently from the US PMIs last Friday and the US Consumer Confidence report this week. Although such
data keeps the interest rates expectations stable around two cuts by the end of
the year, it should also support the risk sentiment amid a pickup in growth.
This could be a headwind for the greenback.
The NZD, on the other hand,
has been under pressure due to some US Dollar strength this week. It looks like
the price action is being influenced more by month-end, quarter-end and half
year-end flows rather than something fundamental. We had also a key breakout in
USDJPY yesterday and flows there might have spilled over to other major pairs.
NZDUSD
Technical Analysis – Daily Timeframe
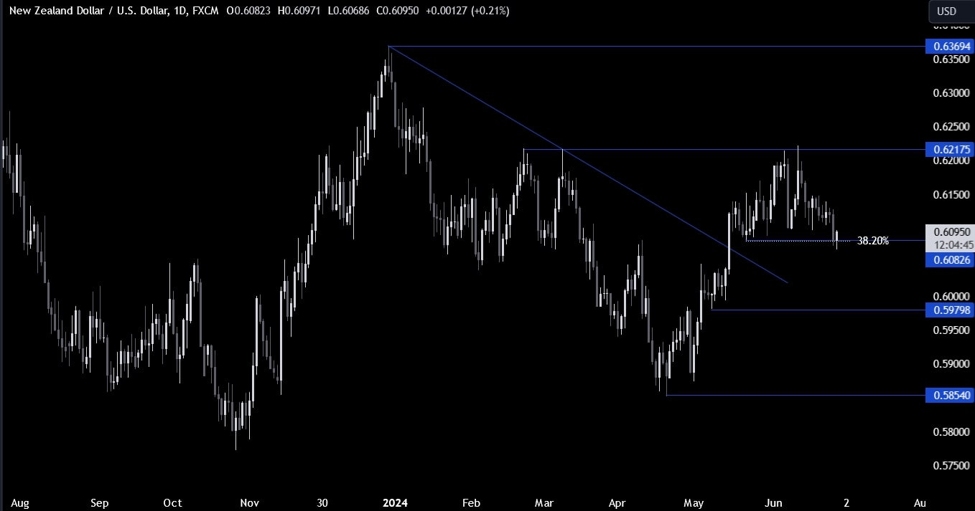
NZDUSD Daily
On the daily chart, we can
see that NZDUSD is bouncing on the key support around the 0.6082 level where we have also the
38.2% Fibonacci retracement level for confluence. The price yesterday probed below
the level but eventually rallied back above it.
This is where the buyers
will likely pile in with a defined risk below the support to position for a
rally back into the 0.6217 resistance. The sellers, on the other hand, will
want to see the price breaking lower again to gain more conviction and increase
the bearish bets into the 0.60 handle next.
NZDUSD Technical
Analysis – 4 hour Timeframe
NZDUSD 4 hour
On the 4 hour chart, we can
see that the price action has been mostly rangebound between the 0.6082 support
and the 0.6217 resistance. The buyers will want to see the price breaking above
the downward trendline
to gain more conviction and increase the bullish bets into the 0.6217
resistance next.
The sellers, on the other hand, will likely lean on the trendline
with a defined risk above it and position for a break below the support with a
better risk to reward setup.
NZDUSD Technical
Analysis – 1 hour Timeframe
NZDUSD 1 hour
On the 1 hour chart, we can
see that we have a strong resistance zone around the 0.6145 level where the
price got rejected from several times. This is what the buyers will ultimately
need to break to extend the rally towards the 0.6217 resistance. The red lines
define the average daily range for today.
Upcoming
Catalysts
Today we get the latest US Jobless Claims figures, while tomorrow we conclude
the week with the US PCE report.