- Canadian Dollar bolstered by rising market sentiment.
- Canada posted a 0.3% uptick in GDP, propping up CAD.
- US PCE inflation also ticked lower, further bolstering rate cut hopes.
The Canadian Dollar (CAD) found some room on the high side on Friday, pushing up by a scant tenth of a percent against the US Dollar amid choppy intraday price action after key economic data broadly met market expectations. Canadian Gross Domestic Product (GDP) ticked higher and US Personal Consumption Expenditure Price Index (PCE) inflation figures cooled slightly.
Canada posted a slight gain in GDP growth in April, rebounding from the previous month’s flat print. A stacked US data docket also generally met market expectations, though US Personal Spending failed to meet expectations despite a post-revision improvement.
Daily digest market movers: Canadian GDP rebounds, US inflation continues to ease for now
- Canadian MoM GDP posted a 0.3% increase in April, meeting market expectations and recovering from the previous month’s 0.0%.
- US PCE Price Index inflation also eased to 2.6% YoY in May, meeting market forecasts and cooling from the previous 2.8%.
- Market bets of a September rate cut from the Federal Reserve (Fed) have ticked higher post-PCE. According to the CME’s FedWatch Tool, rate markets are pricing in 66% odds of at least a quarter-point rate trim from the Fed on September 18, up from a flat 60% pre-PCE inflation.
- University of Michigan (UoM) 5-year Consumer Inflation Expectations also ticked down to 3.0% in June, down from previous 3.1%.
- UoM Consumer Sentiment Index for June also surged to 68.2 from 65.6, vaulting over median market forecasts of 65.8.
Canadian Dollar PRICE Today
The table below shows the percentage change of Canadian Dollar (CAD) against listed major currencies today. Canadian Dollar was the strongest against the Japanese Yen.
| USD | EUR | GBP | JPY | CAD | AUD | NZD | CHF | |
|---|---|---|---|---|---|---|---|---|
| USD | -0.15% | -0.02% | 0.03% | -0.14% | -0.41% | -0.20% | -0.01% | |
| EUR | 0.15% | 0.12% | 0.17% | 0.00% | -0.27% | -0.06% | 0.13% | |
| GBP | 0.02% | -0.12% | 0.02% | -0.13% | -0.39% | -0.18% | -0.02% | |
| JPY | -0.03% | -0.17% | -0.02% | -0.19% | -0.44% | -0.24% | -0.05% | |
| CAD | 0.14% | -0.01% | 0.13% | 0.19% | -0.28% | -0.06% | 0.10% | |
| AUD | 0.41% | 0.27% | 0.39% | 0.44% | 0.28% | 0.21% | 0.38% | |
| NZD | 0.20% | 0.06% | 0.18% | 0.24% | 0.06% | -0.21% | 0.16% | |
| CHF | 0.01% | -0.13% | 0.02% | 0.05% | -0.10% | -0.38% | -0.16% |
The heat map shows percentage changes of major currencies against each other. The base currency is picked from the left column, while the quote currency is picked from the top row. For example, if you pick the Canadian Dollar from the left column and move along the horizontal line to the US Dollar, the percentage change displayed in the box will represent CAD (base)/USD (quote).
Technical analysis: Canadian Dollar recovers ground on Friday, sends USD/CAD into familiar levels
The Canadian Dollar found a bid on Friday, gaining ground against the majority of its major currency peers as markets get set to wrap up a relatively sedate trading week. The CAD gained around one-tenth of one percent against the US Dollar on Friday and climbed nearly one-quarter of one percent against the broadly-battered Japanese Yen.
USD/CAD briefly found a fresh high for the week near 1.3735 early Friday before settling back into familiar near-term lows near 1.3675. CAD strength has briefly halted a recent upswing in the pair on a Greenback bid, sending USD/CAD into a rough near-term corkscrew around the 200-hour Exponential Moving Average (EMA) near the 1.3700 handle.
USD/CAD hourly chart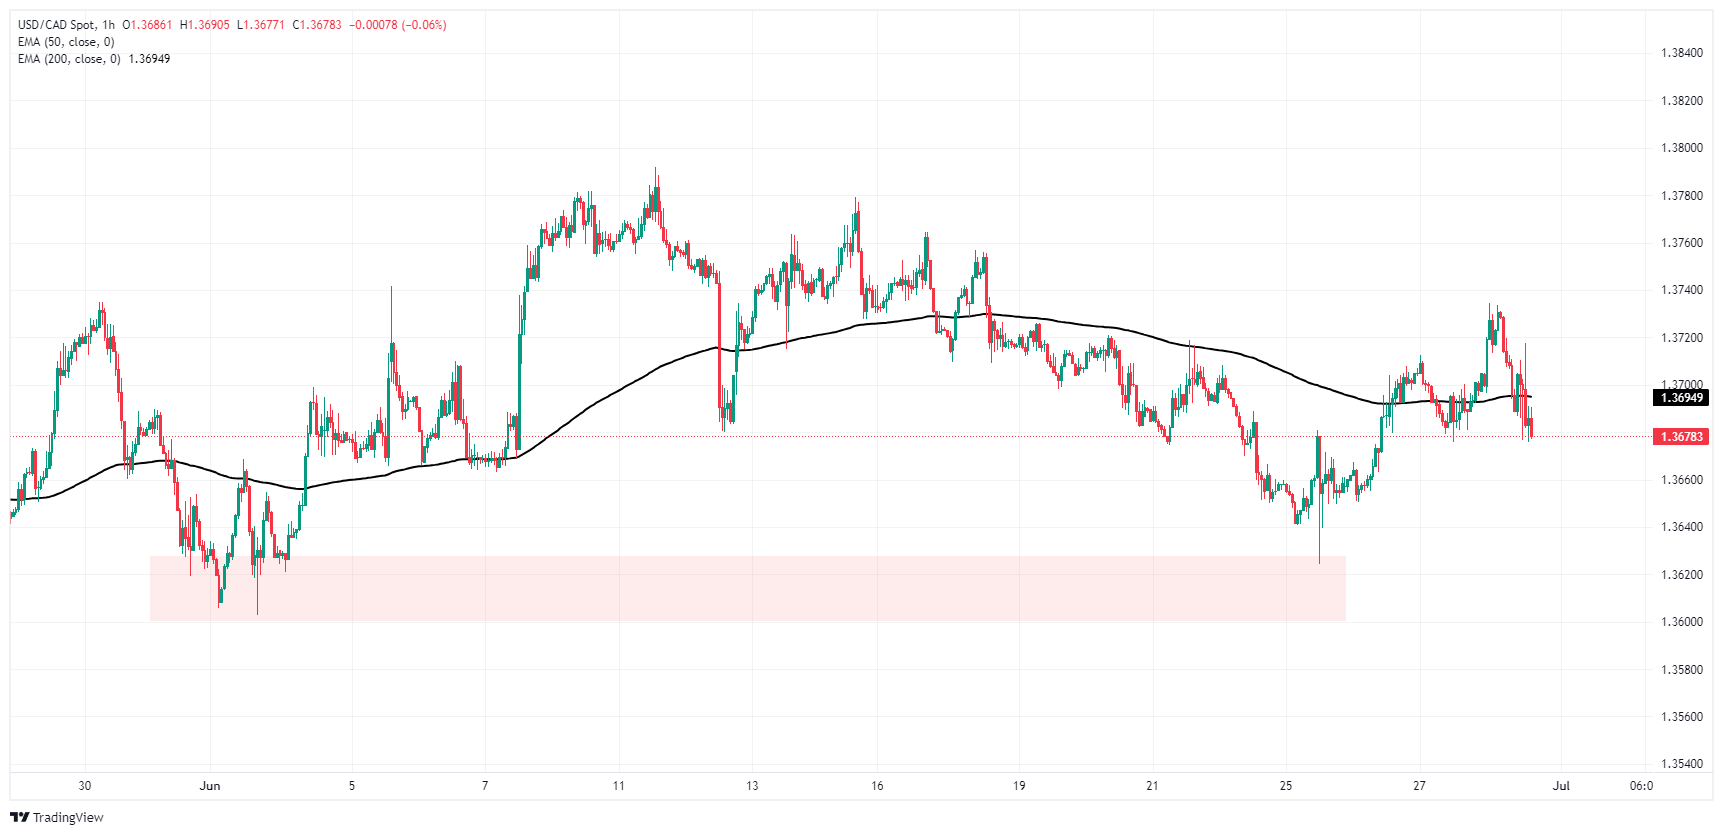
USD/CAD daily chart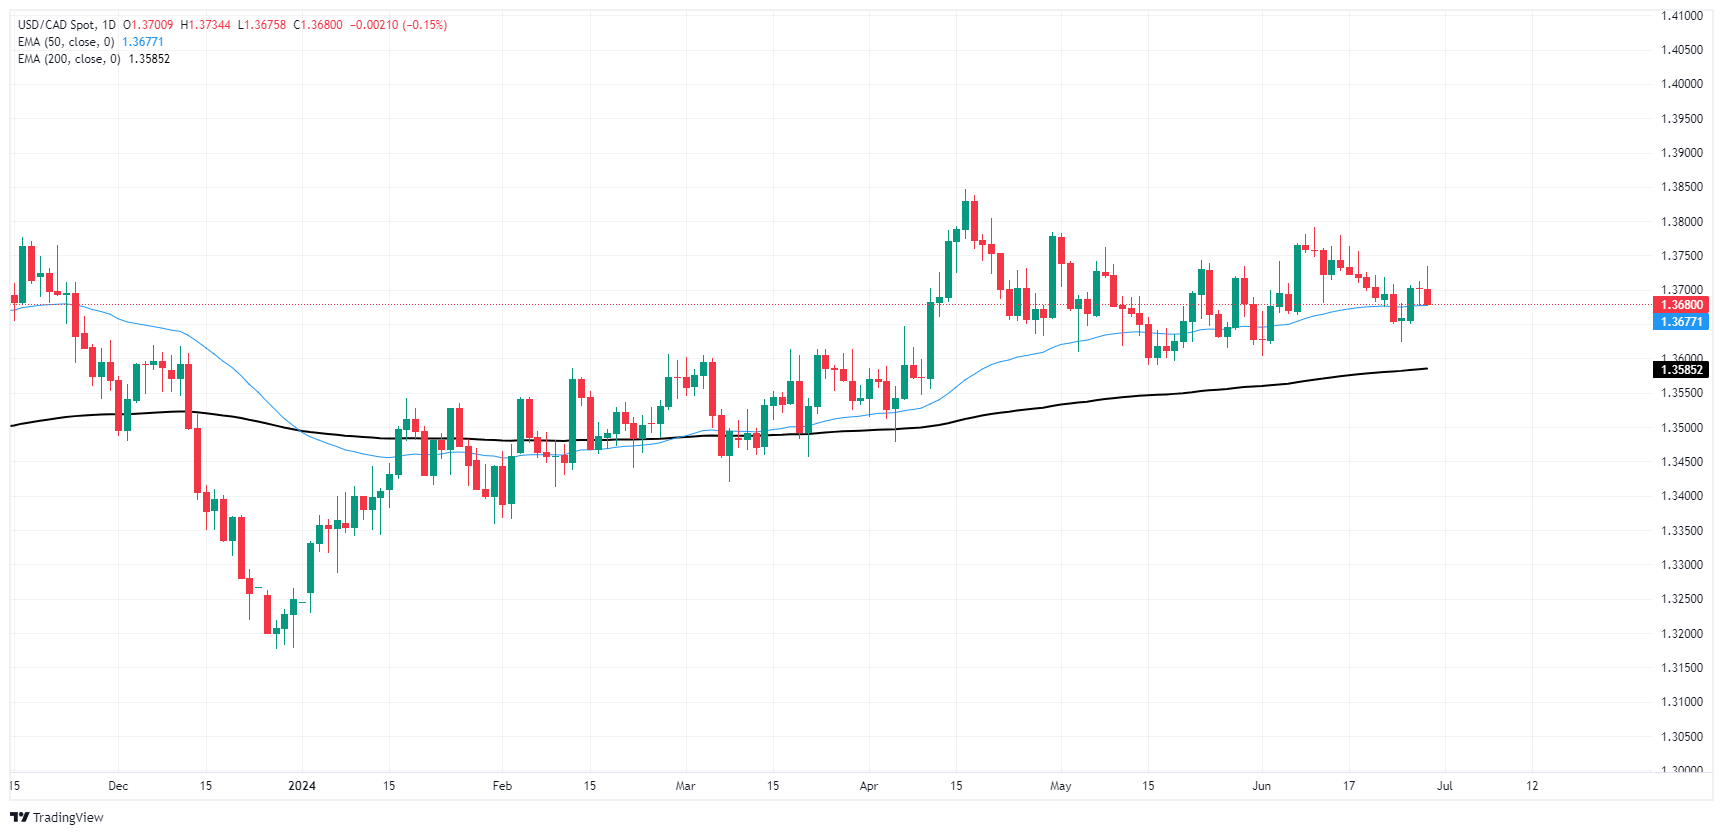
Economic Indicator
Core Personal Consumption Expenditures – Price Index (YoY)
The Core Personal Consumption Expenditures (PCE), released by the US Bureau of Economic Analysis on a monthly basis, measures the changes in the prices of goods and services purchased by consumers in the United States (US). The PCE Price Index is also the Federal Reserve’s (Fed) preferred gauge of inflation. The YoY reading compares the prices of goods in the reference month to the same month a year earlier. The core reading excludes the so-called more volatile food and energy components to give a more accurate measurement of price pressures.” Generally, a high reading is bullish for the US Dollar (USD), while a low reading is bearish.