- GBP/USD is steady as worse-than-expected US Consumer Confidence report, weighs on US Dollar.
- Technical outlook shows a ‘bullish piercing’ pattern, but momentum favors sellers, with RSI standing bearish.
- Key support levels will be 100-DMA and the May 3 high at 1.2640/34, with further losses eyed beneath the psychological level of 1.2600.
- Key resistance levels are 1.2700 and previous support trendline turned resistance at 1.2730/40.
The Pound Sterling stayed firm against the Greenback on Tuesday, even though the latter remained positive, and a worse-than-expected Consumer Confidence report capped the US Dollar advance. Therefore, the GBP/USD trades at 1.2678, virtually unchanged.
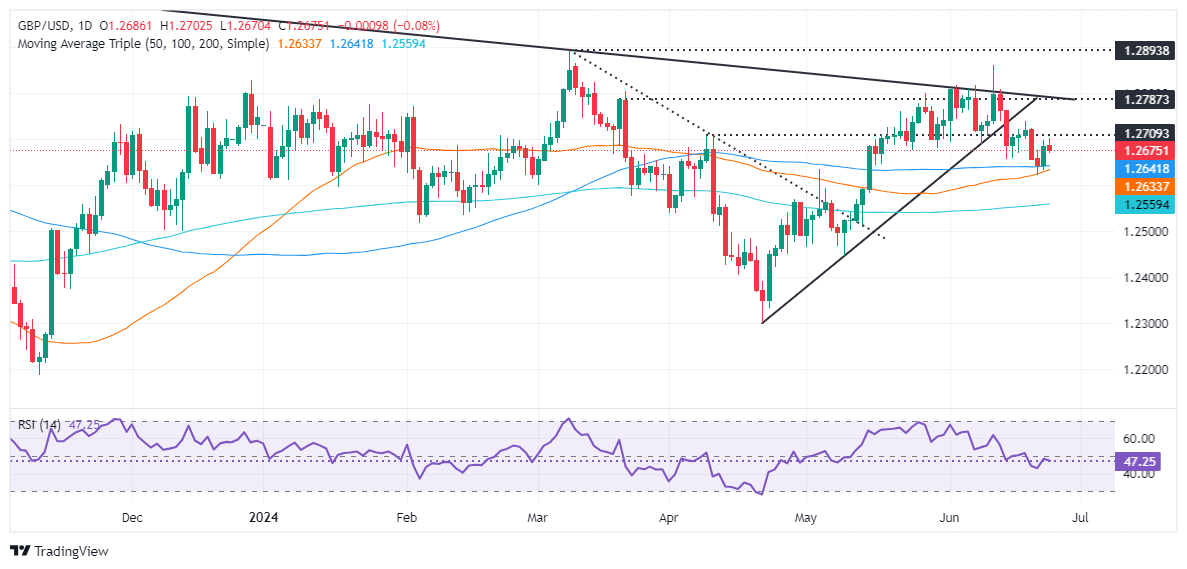
GBP/USD Price Analysis: Technical outlook
The pair formed a ‘bullish piercing’ pattern, hinting that traders could challenge the next resistance seen at 1.2700, yet buyers remain reluctant to lift the GBP/USD towards that level.
Momentum still favors sellers, as depicted by the Relative Strength Index (RSI), which remains bearish and aims lower. That said, the GBP/USD path of least resistance is downwards.
The first support will be the confluence of the 100-day moving average (DMA) and the May 3 high-turned support at around 1.2640/34, closely followed by the 50-DMA at 1.2632. Once that area is surpassed, the psychological 1.2600 mark would be up next, ahead of the 200-DMA at 1.2555.
For a bullish continuation, traders must claim 1.2700 and clear a previous support trendline turned resistance at around 1.2730/40.

