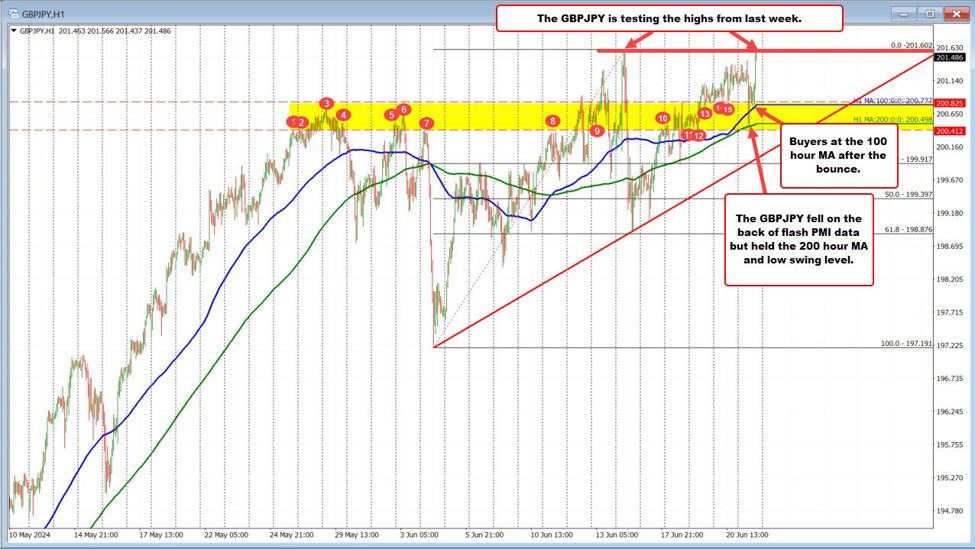
The GBPJPY has been on an upward trend this week, but it turned lower during the European session following weaker-than-expected flash PMI data. The price dropped below its 100-hour moving average (blue line on the chart above at 200.77) but found support near the 200-hour moving average and the lower boundary of a swing area between 200.41 and 200.825.
After finding support, the pair rallied to last week’s high of 201.60. A break above this level could trigger further upside momentum, pushing the GBPJPY to its highest level since September 2008. Additionally, the price has moved above the 61.8% retracement level of the trading range since the 2007 high, which is at 199.808 (see monthly chart below).
Buyers remain in control. The only thing in the way for further gains right now is the high price from last week. Sellers who think the price has gone too far could lean against that level with a stop above.
Buyers meanwhile want to see a break with momentum above that level.