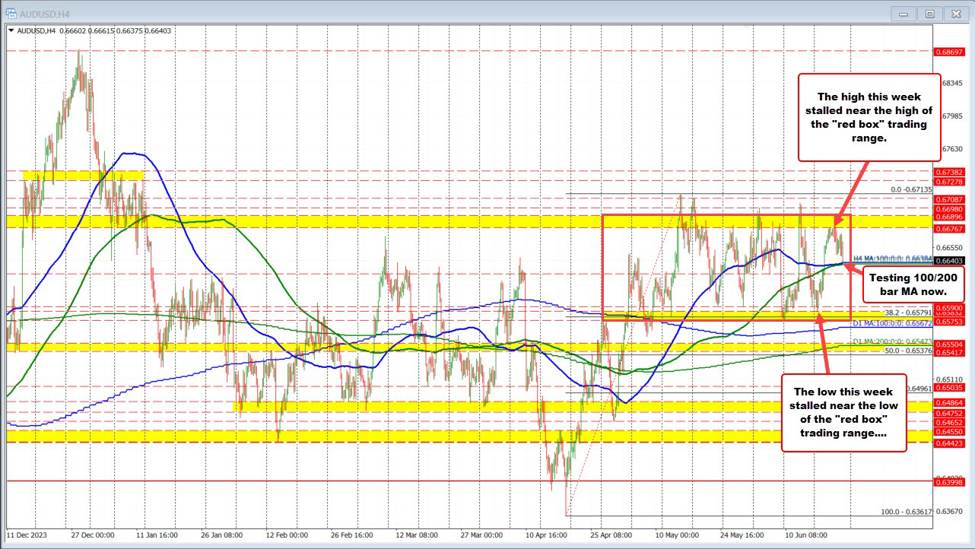
The AUDUSD this week traded down to test a swing area between 0.6575 and 0.6590. The subsequent move to the upside then tested the high of a swing area between 0.6677 and 0.66896 (see the chart below).
Staying with the confines of the “red box” where most of the trading has taken place over the last 6-7 weeks keeps the ups and downs as the favored trading strategy.
The price decline off the high has now reached the 100 and 200-bar moving averages on the 4-hour chart. Both those moving averages are near converged at 0.6638. They also represent the bias-defining level between the extremes.
Moving below the moving averages now would tilt the technical bias more in favor of the seller’s with the low of the trading range as the next key targets (low of the red box).
Staying above the moving averages keeps the buyers more in control, and the door open for a retest of the high of the trading range (high of the red box).
At some point the red box will be broken and remain broken as market traders figure out the next trend-like move. For now buyers and sellers are happy to trade the range.