Fundamental
Overview
The USD last week lost
ground across the board following the soft US CPI report as the market priced back in two rate
cuts by the end of the year. The moves were reversed soon after though as we
got a bit more hawkish than expected FOMC decision where the dot plot showed that the Fed expected just one cut for
this year despite the soft US CPI report.
Fed Chair Powell backpedalled on the projections nonetheless making
them a bit less worrying as the central bank remains very data dependent. The
rally in the US Dollar eventually picked up steam as the risk sentiment turned
more cautious.
The NZD, on the other hand,
got pressured mainly because of the risk-off sentiment and the US Dollar
strength. Moreover, today the Services
PMI came in very weak which weighed on the Kiwi in the Asian session.
NZDUSD
Technical Analysis – Daily Timeframe
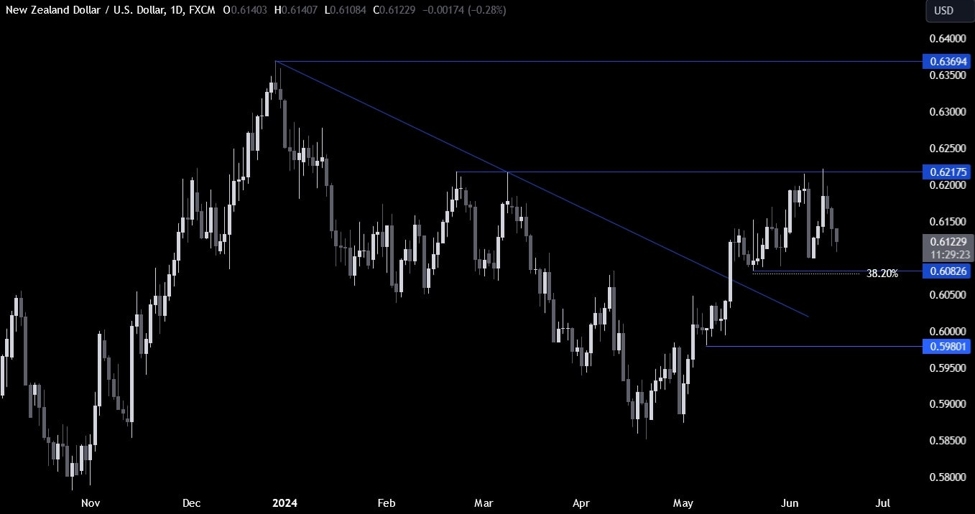
NZDUSD Daily
On the daily chart, we can
see that NZDUSD spiked into the key 0.6217 resistance following the soft US CPI report
and then sold off following the more hawkish than expected FOMC decision. We
have a strong support around the 0.6082 level where we have also the 38.2% Fibonacci retracement level for confluence.
This is where we can expect
the buyers to step in with a defined risk below the support to position for a
rally into new highs with a better risk to reward setup. The sellers, on the
other hand, will want to see the price breaking lower to increase the bearish
bets into the 0.60 handle next.
NZDUSD Technical Analysis – 4 hour Timeframe
NZDUSD 4 hour
On the 4 hour chart, we can
see that the price action has been mostly rangebound between the 0.6082 support
and the 0.6217 resistance. These will be the key levels that the market will likely
need to break to start a more sustained trend. For now, will could keep
bouncing around as the market awaits new catalysts.
NZDUSD Technical
Analysis – 1 hour Timeframe
NZDUSD 1 hour
On the 1 hour chart, we can
see that from a risk management perspective, the sellers have a good resistance
zone around the 0.6142 level where they will also find the confluence of the trendline
and the 38.2% Fibonacci retracement level.
The buyers, on the other
hand, will want to see the price breaking higher to gain some conviction and
start targeting the break above the 0.6217 resistance. The red lines define the
average
daily range for today.
Upcoming
Catalysts
Tomorrow we have the US Retail Sales and US Industrial Production. On Thursday,
we get the New Zealand GDP and later in the day the US Housing Starts, Building
Permits and the US Jobless Claims figures. On Friday, we conclude the week with
the US PMIs.
