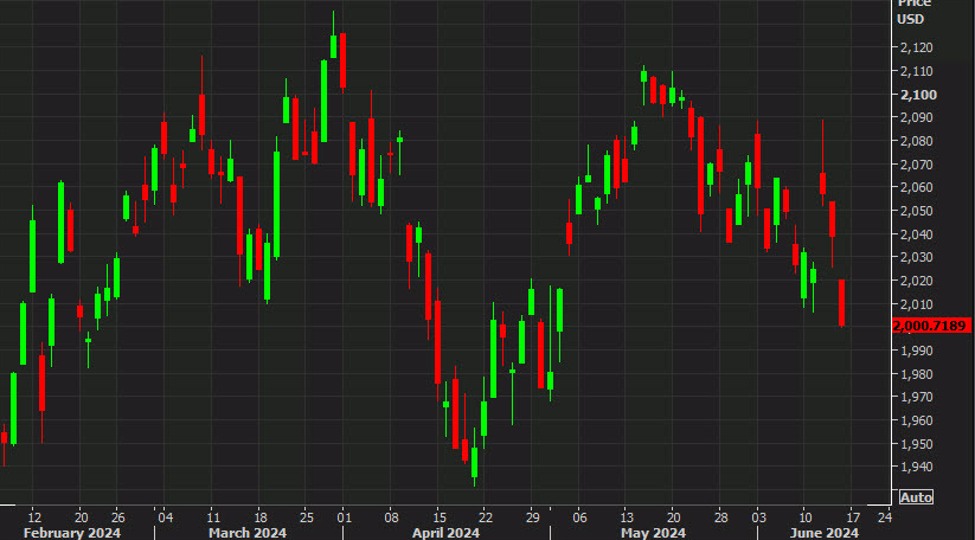
Russell 2000 daily
This is what regime change in the stock market looks like.
On Wednesday, the Russell 2000 surged on a soft CPI report and it bumped higher yesterday on PPI. But here we are at the lows of the week and at a six-week low, as it reversed a 2% gain.
For 18 months, the market has been trading higher on falling CPI but after a big cooling in the latest data, this shows that regime is over. The market has moved past inflation and is now more worried about growth. The Russell 2000 is cyclical and isn’t the market beneficiary of the first wave of AI (though I believe AI-based automation will ultimately goose profits).
So this chart is what you get, with a break of support after stalling ahead of 2100 and several failures to break that level. The chart could also be forming into a head-and-shoulders top that would target a 14% decline from here.
It doesn’t look great here in the short term, but that head-and-shoulders isn’t a done deal. There are a series of higher lows so far this year and some consolidation above the old 2022-23 range that topped near 2000.
I’ll be watching closely in the week ahead.
