- Mexican Peso recovers slightly, breaking three-day losing streak.
- Mexico’s wider April trade deficit and slower economic growth are reported by INEGI.
- Banxico minutes show division on rate cuts amid ongoing inflation, emphasizing commitment to price stability.
- US Durable Goods Orders beat expectations, but March’s figures are revised down heavily.
The Mexican Peso snapped three days of losses and climbed more than 0.10% against the US Dollar on Friday amid an improvement in risk appetite and softer-than-expected US data that weighed on the Greenback. At the time of writing, the USD/MXN trades at 16.69, down 0.17%.
Mexico’s National Statistics Agency (INEGI) revealed a wider-than-expected trade deficit in April. On Thursday, INEGI announced that the economy grew at a slower pace than foreseen, while inflation for the Mid-month was mixed.
The Bank of Mexico featured its last monetary policy meeting minutes, which revealed the Governing Council is divided over when to resume interest rate cuts amid stubbornly stickier inflation. At the latest meeting, Banxico upwardly revised inflation and mentioned that it remains committed to price stability.
Across the border, the US Department of Commerce revealed that Durable Goods Orders exceeded expectations but revised March’s figures downward from 2.4% to 0.8%. Recently, a survey showed that consumer sentiment shifted to slightly pessimistic, according to a University of Michigan Survey. The same poll revealed that inflation expectations are tilted to the downside.
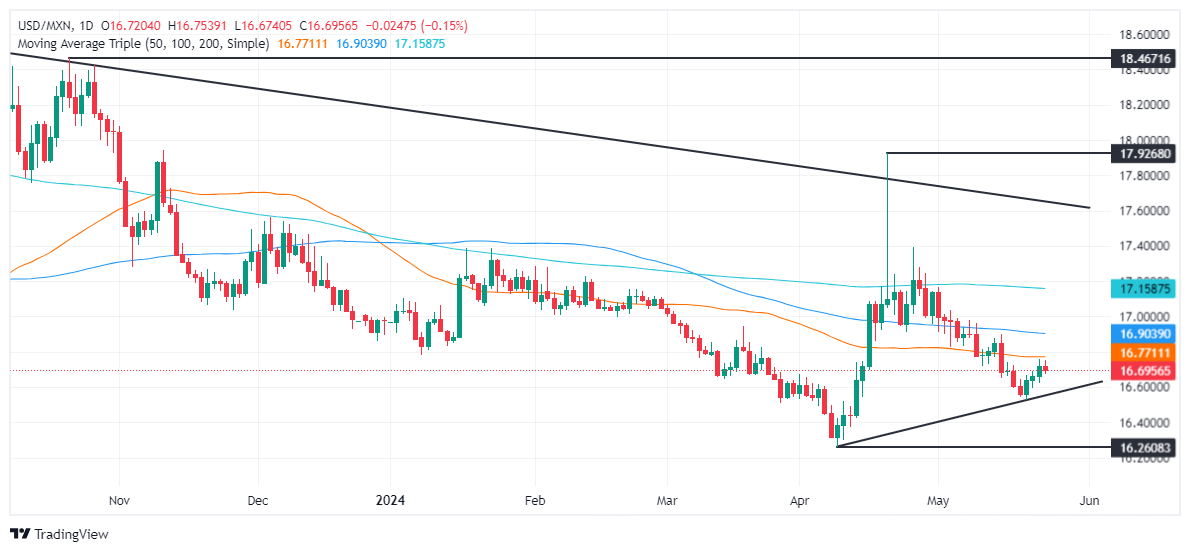
Given the fundamental backdrop, the USD/MXN resumed its downtrend as buyers struggled to breach strong resistance at the 100-day Simple Moving Average (SMA) at 16.76, opening the door for a retracement.
Daily digest market movers: Mexican Peso leans on soft US data to appreciate against USD
- Mexico’s Balance of Trade in April was $-3.746 billion, exceeding forecasts of $-0.8 billion and March’s $2.09 billion surplus.
- Mexico’s economy is slowing as expected as Gross Domestic Product for Q1 2024 grew 1.6% YoY, aligned with estimates but trailing 2023’a last quarter rate of 2.5%.
- Mid-month headline inflation rose from 4.63% to 4.78%, but the core continued to aim lower. Underlying inflation for the same period stood at 4.31% YoY, down from 4.39%.
- May’s Citibanamex poll showed that most economists estimate Banxico will cut rates on June 27 from 11% to 10.75%. The median expects headline inflation at 4.21% and core at 4.07% in 2024.
- April’s US Durable Goods Orders increased by 0.7% MoM, exceeding estimates of -0.8% contraction but lower than the downwardly revised March figures.
- The UoM Consumer Sentiment Index in May was 69.1, below April’s 77.2, but exceeded forecasts of 67.5. Inflation Expectations for one year stood at 3.3%, up from 3.2%. For a five-year period, they were unchanged at 3%.
- Despite that, fed funds rate futures estimated just 26 basis points of easing toward the end of the year after S&P Global revealed that US business activity is gathering steam.
Technical analysis: Mexican Peso counter attacks as USD/MXN tumbles below 16.70
The USD/MXN downtrend extended after buyers were unable to cancel the 100-day SMA at 16.76. The exotic pair retreated afterward, down some 365 pips and back below the psychological 16.70 mark. Momentum is on the sellers’ side as the Relative Strength Index (RSI) aims downward in bearish territory.
Due to seller strength, the path of least resistance is downward. The pair would meet its next support at 16.62, the 2023 low, followed by the May 21 cycle low at 16.52 and the year-to-date low of 16.25.
Conversely, if buyers reclaim 16.70, they must clear the 100-day SMA at 16.76 before extending its gains. In that outcome, key resistance levels emerge like the 50-day SMA at 16.89, the 17.00 psychological figure and the 200-day SMA at 17.15.
Inflation FAQs
Inflation measures the rise in the price of a representative basket of goods and services. Headline inflation is usually expressed as a percentage change on a month-on-month (MoM) and year-on-year (YoY) basis. Core inflation excludes more volatile elements such as food and fuel which can fluctuate because of geopolitical and seasonal factors. Core inflation is the figure economists focus on and is the level targeted by central banks, which are mandated to keep inflation at a manageable level, usually around 2%.
The Consumer Price Index (CPI) measures the change in prices of a basket of goods and services over a period of time. It is usually expressed as a percentage change on a month-on-month (MoM) and year-on-year (YoY) basis. Core CPI is the figure targeted by central banks as it excludes volatile food and fuel inputs. When Core CPI rises above 2% it usually results in higher interest rates and vice versa when it falls below 2%. Since higher interest rates are positive for a currency, higher inflation usually results in a stronger currency. The opposite is true when inflation falls.
Although it may seem counter-intuitive, high inflation in a country pushes up the value of its currency and vice versa for lower inflation. This is because the central bank will normally raise interest rates to combat the higher inflation, which attract more global capital inflows from investors looking for a lucrative place to park their money.
Formerly, Gold was the asset investors turned to in times of high inflation because it preserved its value, and whilst investors will often still buy Gold for its safe-haven properties in times of extreme market turmoil, this is not the case most of the time. This is because when inflation is high, central banks will put up interest rates to combat it. Higher interest rates are negative for Gold because they increase the opportunity-cost of holding Gold vis-a-vis an interest-bearing asset or placing the money in a cash deposit account. On the flipside, lower inflation tends to be positive for Gold as it brings interest rates down, making the bright metal a more viable investment alternative.

