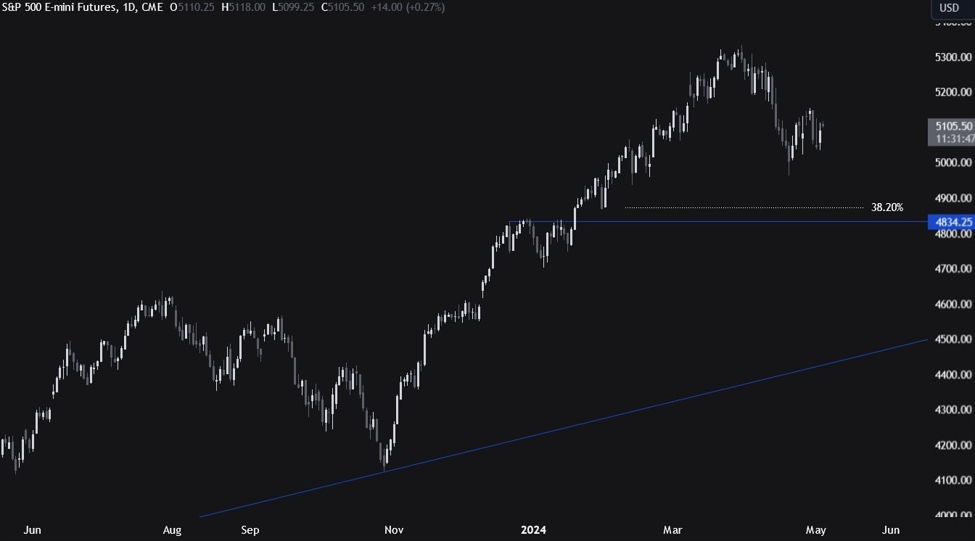
The S&P 500 has been consolidating around the 5000-5100 range for more than two weeks now with the market awaiting the key US data as it’s getting more and more wary of the inflation risk that could lead to more tightening. The more dovish than expected Fed’s decision and Powell’s press conference led to a short term spike that got faded soon after as the focus shifted towards the US data.
Now, the big rally in Q1 was supported by rate cuts expectations and a reacceleration in economic activity that led to positive risk sentiment all around. These expectations started to collide with inflation risks after the third consecutive hot US CPI report and a hawkish repricing in interest rates expectations.
The market might keep on going up as long as the Fed remains unwilling to tighten further, but that will need to be supported by benign economic data and less inflationary risks. The first test will come today with the release of the US NFP report and the ISM Services PMI. The next will come in two weeks with the release of the US CPI on May 15th.
S&P 500 E-mini Futures Technical Analysis – Daily Timeframe
S&P 500 E-mini Futures Daily
On the daily chart, we can see that the S&P 500 topped more or less with the latest US CPI release and corrected into the 5000 level with geopolitical events exacerbating the selloff. We have a good support zone around the 4835 level where we can also find the confluence of the 38.2% Fibonacci retracement level. If the market falls into that zone, it would effectively erase the entire Q1 rally. That’s also where the buyers will start to pile in more aggressively, while the sellers will look for a further break lower to target the trendline around the 4600 level.
S&P 500 E-mini Futures Technical Analysis – 1 hour Timeframe
S&P 500 E-mini Futures 1 hour
On the 1 hour chart, we can see the rangebound price action of the last two weeks. We have a strong resistance around the 5120 level and a short term support around the 5040 level. The data today will likely trigger a breakout on either side, so buckle up!
