GBP/USD daily
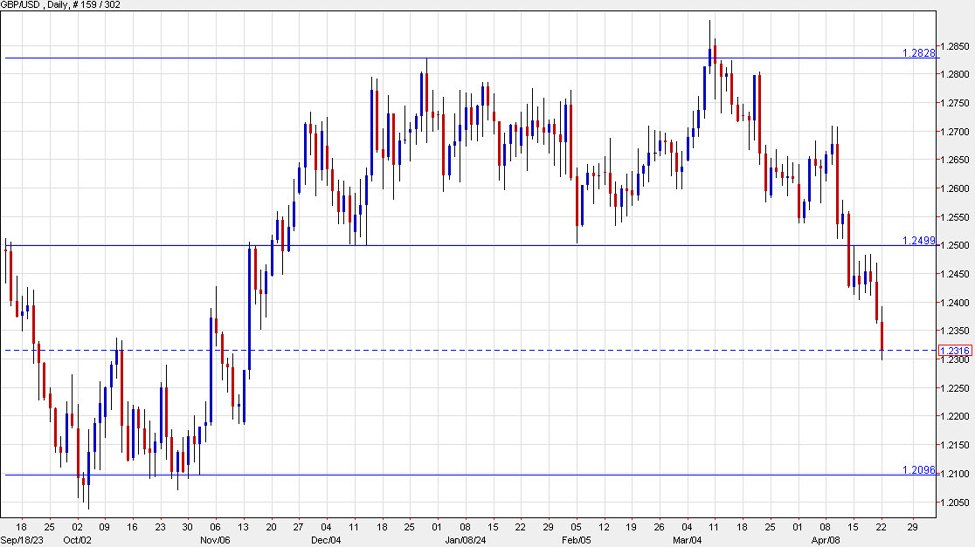
Cable carved out a range from roughly 1.25-1.28 from December to early March in what was a slog of a market as we all weighed whether the BOE would keep its hawkish stance and the Fed would signal rate cuts.
For a brief moment in March, it looked like the pair would break higher but it was quickly sucked back down and that was the first sign that sellers were in control.
The fundamentals eventually took over as UK inflation faded and US growth/inflation continued to steam ahead. That’s ultimately led to broad US dollar strength and cable hasn’t been spared.
The break below 1.2500 was strong at first and it consolidated for a week at 1.2430, retesting 1.25000 several times. However it Friday the break continued and it’s now extended down to 1.2316.
What’s next?
A 300-pip range deserves a 300-pip break. Given today’s fall on light newsflow, there’s a signal to sell that certainly is underscored by the poor sentiment in broader markets. There isn’t much support until 1.2200 which should be interim support. Eventually, I think we go and retest the Oct/Nov lows near 1.2100.
For now though, this move looks a bit stretched. There isn’t a strong catalyst to press the pound lower or the US dollar higher. We will get some data on US GDP and PCE later this week that could be a driver. We also get the S&P Global PMIs tomorrow and those are good forward-looking indicators. I’ll be looking for any hints there on relative economic shifts.
