USD
JPY
- The BoJ kept its monetary policy unchanged as expected at the last meeting with
interest rates at -0.10% and the 10 year JGB yield target at 0% with 1% as a
reference cap. - The Japanese CPI beat expectations although all
measures eased further from the prior readings. - The latest Unemployment Rate remained unchanged hovering around
cycle lows. - The Japanese PMIs improved for both the Manufacturing
and Services measures although the former remains in contractionary territory. - The Japanese wage data beat expectations by a big margin.
- The Tokyo CPI, which is seen as a leading
indicator for National CPI, recently came in line with expectations with the
measures increasing from the prior report. - The market expects the BoJ to hike
rates in March.
USDJPY Technical Analysis –
Daily Timeframe
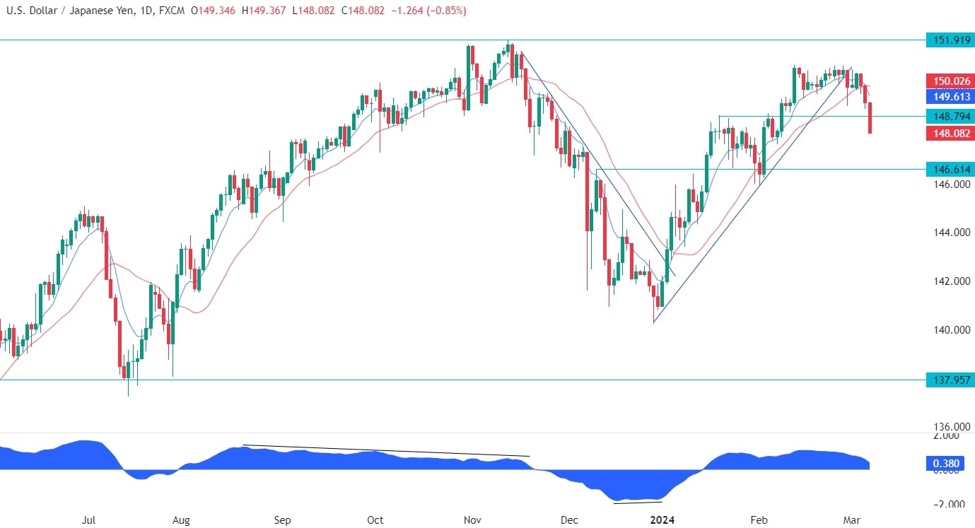
USDJPY Daily
On the daily chart, we can see
that USDJPY is rolling over as the market participants started to position for
the BoJ to exit the negative interest rates policy (NIRP) probably at the
upcoming meeting on the 19th of March. The massive Yen appreciation
started with the miss in the US ISM Manufacturing PMI that depressed global
yields and was followed by a miss in the ISM Services PMI and other US labour
market data. On the Japanese front, the BoJ members started to deliver hawkish
comments recently and we got reports of imminent changes at the upcoming policy
meeting. The strong wage data today just added further fuel to the speculation
and triggered further carry trades unwind.
USDJPY
Technical Analysis – 4 hour Timeframe
USDJPY 4 hour
On the 4 hour chart, we can see that the sellers
piled in aggressively on a break below the support zone
around the 149.60 level and increased the bearish bets on the break below the
148.80 level. The target should now be the 146.60 level and it looks like
there’s nothing now that can’t stop this train going as the buyers rush for the
exits and the sellers sell any rally into the BoJ meeting. One risk could come
from a hot NFP report tomorrow, but if the data comes out in line or even below
expectations, then we could see another strong wave of selling coming into the
market.
USDJPY Technical Analysis –
1 hour Timeframe
USDJPY 1 hour
On the 1 hour chart, we can see that if we
were to get a pullback, a good resistance where the sellers can short from
would be the resistance turned
support around the 148.80 level where we can find the confluence with
the 50% Fibonacci
retracement level, the trendline and
the red 21 moving average. The
buyers, on the other hand, will want to see the price breaking above the
trendline to start getting back into the market and target the highs around the
150.90 level, although the chances at the moment are very low.
Upcoming Events
Today we get the latest US Jobless Claims figures,
while tomorrow we conclude the week with the US NFP report.
